Figure 3.
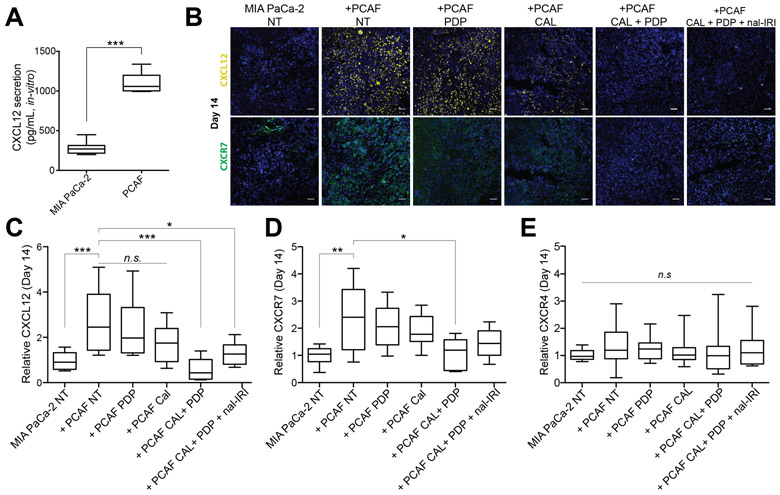
Cal + PDP reduces CXCL12 and CXCR7 expression in vivo.
(A) PCAFs secrete significantly more CXCL12 than MIA-PaCa-2 cells in vitro (1103 ± 47.1 pg/mL vs. 275.5 ± 33.7 pg/mL; n=7 wells per group, p<0.001). (B) Representative immunofluorescence images are shown of CXCL12 (yellow, top row), CXCR7 (green, bottom row), and DAPI in MIA-PaCa-2 No Treatment, and MIA PaCa-2 + PCAF tumors subjected to (i) No Treatment, (ii) PDP, (iii) CAL, (iv) CAL+PDP, (v) CAL+PDP+20 mg/kg, nal-IRI 14 days after implantation (corresponding to the end of the treatment period). Scale bars are 50 μm. To quantify immunofluorescence intensities, 6-10 images evenly across the tumor cross section were recorded from at least 2 tumor samples per condition. The total CXCL12, CXCR7, and CXCR4 fluorescence for each image was normalized to the DAPI area from the same image. (C) Relative CXCL12 intensity was found to be significantly higher in the +PCAF NT condition compared to MIA-PaCa-2 NT 14 days after implantation (2.81 ± 0.29 vs 1.01 ± 0.11; n ≥ 20 images from ≥ 2 animals per group and ≥ 6 slides per animal, p<0.001, Kruskal-Wallis with Dunn’s multiple comparisons test). Relative CXCL12 intensity for +PCAF CAL+PDP and +PCAF CAL+PDP+nal-IRI was significantly lower than +PCAF NT at the same time point (0.551 ± 0.12 and 1.254 ± 0.15 respectively vs. 2.805 ± 0.29, n ≥ 12 images, p < 0.05, Kruskal-Wallis with Dunn’s multiple comparisons test). (D) Relative CXCR7 intensity was found to be significantly higher in the +PCAF NT condition compared to MIA-PaCa-2 NT 14 days after implantation (2.39 ± 0.32 vs. 1.01 ± 0.09, n ≥14 images, p<0.001, One-way ANOVA with Tukey’s multiple comparison test). (D) Relative CXCR7 intensity for +PCAF CAL+PDP was significantly lower than +PCAF NT at the same time point (1.06 ± 0.15 vs. 2.39 ± 0.32, n ≥ 14 images, p < 0.05, One-way ANOVA with Tukey’s multiple comparison test). (E) No statistical differences were detected in the CXCR4 intensity at this time point (n ≥ 14 images, p = 0.77, Kruskal-Wallis). Box and whisker plots denoting the 10th – 90th percentile of all data are shown in C-E.

