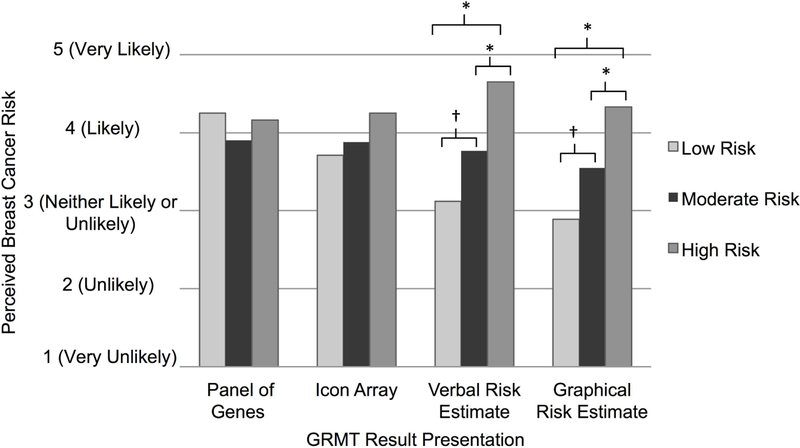
Figure 3.
Perceptions of lifetime risk of developing breast cancer in response to the sample GRMT result presentations. Perceived risk differed significantly across the three hypothetical risk versions in response to the verbal risk estimate presentation (low risk M=3.06; moderate risk M=3.75; high risk M=4.65) and the graphical risk estimate presentation (low risk M=2.86; moderate risk M=3.55; high risk M=4.33). Significant differences between risk versions are indicated (* = p≤.04; † = p=0.06).

