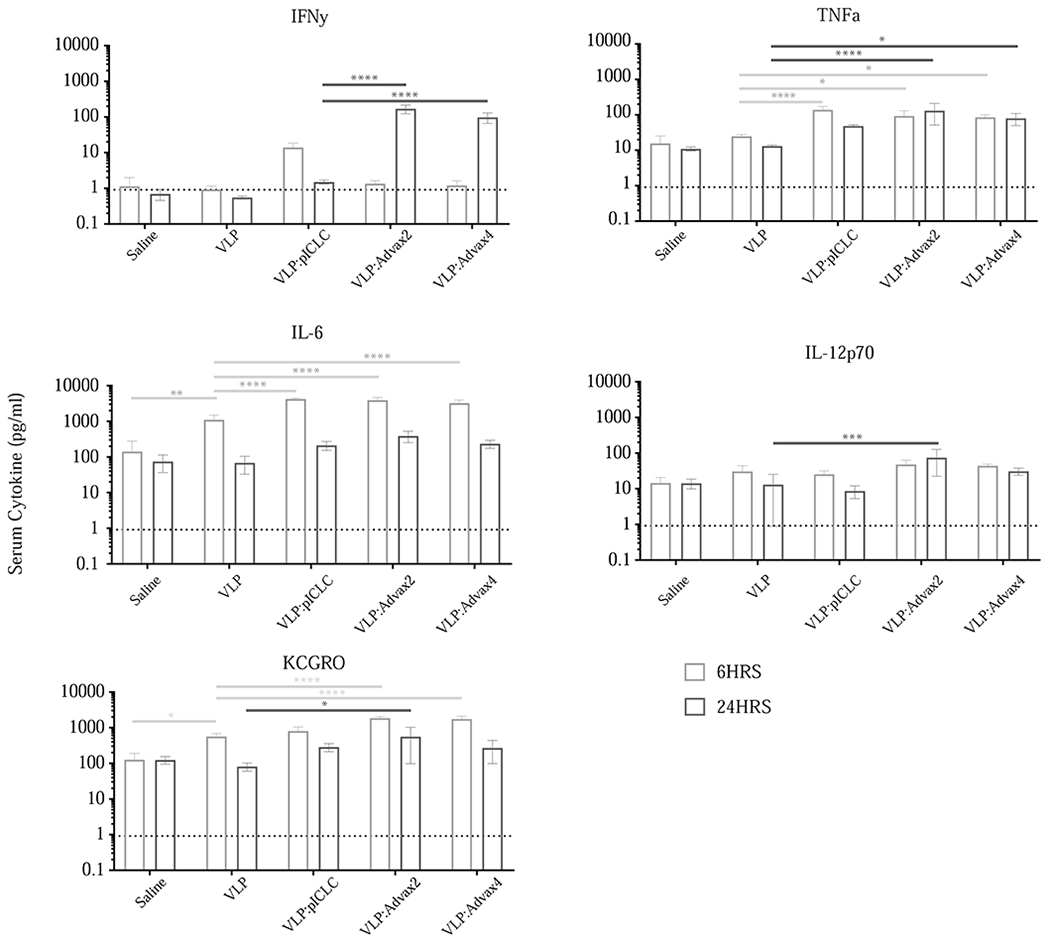
Figure 3.

Cytokine and chemokine levels in sera 6 hours and 24 hours after vaccination. Replicates include at least 5 animals per group; 2 way ANOVA used to compare VLP alone with other treatment groups (* = p<0.05, ** = p<0.005, *** = p<0.0005, **** = p<0.0001).
