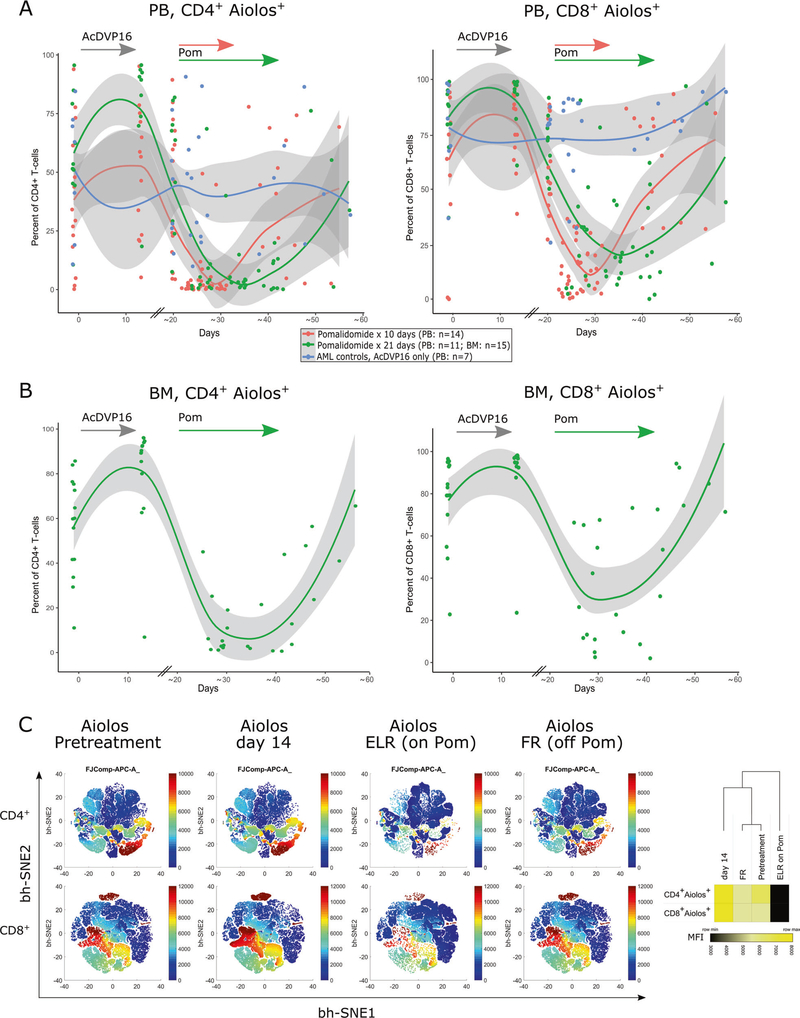
Fig. 3. Aiolos expression in T cells as a pharmacodynamic biomarker of in vivo pomalidomide effect.
Aiolos staining and analysis by flow cytometry was performed on paired CD4+ or CD8+ T cell samples (PB, n = 25; BM, n = 15). Fixed timepoints included a pretreatment, day 14 and a pre-pomalidomide sample at beginning of ELR (around day 20, PB only). PB samples during pomalidomide were drawn every 3–4 days thereafter (for BM only once) until full recovery. The data were summarized in dot plot and nonlinear regression was calculated in R, using a LOESS curve fitting model. a PB samples, 14 patients received pomalidomide for 10 days (red dots/line) and 11 patients for 21 days (green dots/line). PB samples from 7 AML controls who received induction chemotherapy (AcDVP16) only, but not pomalidomide (blue dots/line). AML controls are lacking day 14 sample and modeled curves have to be interpreted accordingly. b For BM samples, only the AML patient group receiving pomalidomide for 21 days was analyzed (n = 15). c bidimensional maps obtained from flow cytometric data using the bh-SNE algorithm depicting serial Aiolos expression on BM CD4+ and CD8+ T cells of the 15 patients presented in (b). Each point in the map represents an individual cell, and the cells are colored according to the intensity of expression of individual markers, as indicated on the color scale to the right of individual maps. Heatmap (right) represents the median fluorescence intensity (MFI) of Aiolos expression in CD4+ and CD8+ T cells at different timepoints. Heatmap and clustering was done using Morpheus software (Broad Institute) using Euclidean distance and average linkage method.

