
Figure 1:
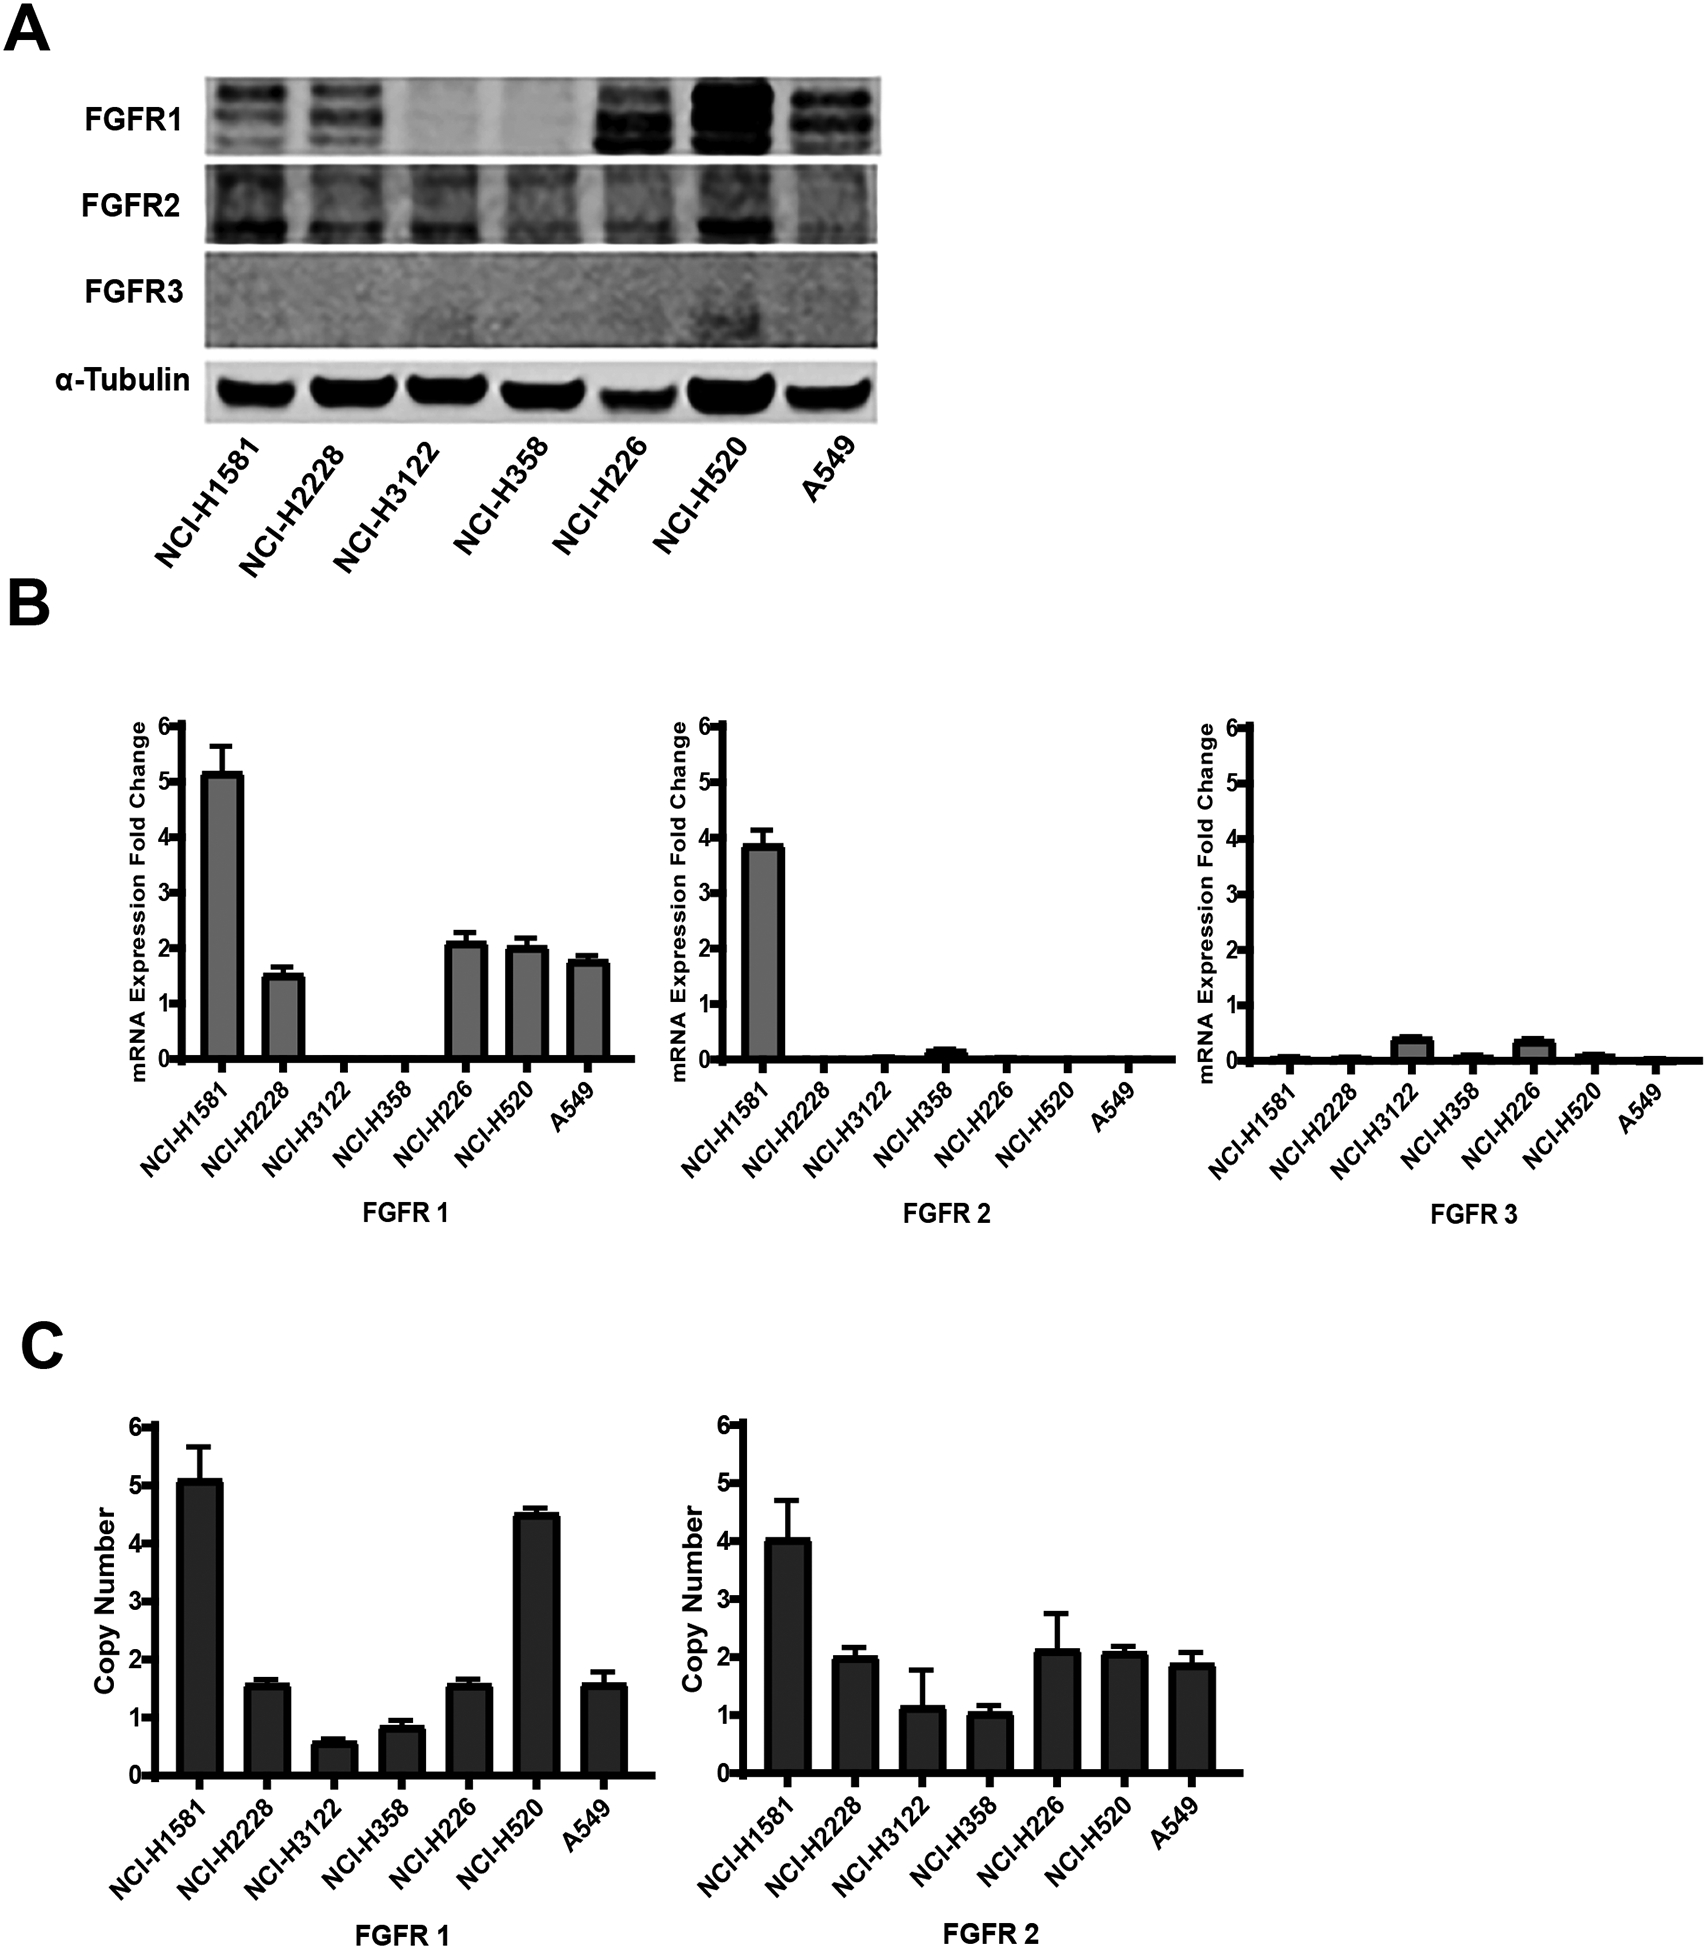
FGFR expression in a panel of seven NSCLC cell lines. (A) Western blot showing FGFR1, FGFR2 and FGFR3 protein levels, (B) FGFR1, FGFR2 and FGFR3 mRNA expression – fold change from normal lung tissue expression (C) FGFR1 and FGFR2 copy number analysis. Columns, mean; bars, SEM (n=3).