
Figure 2.
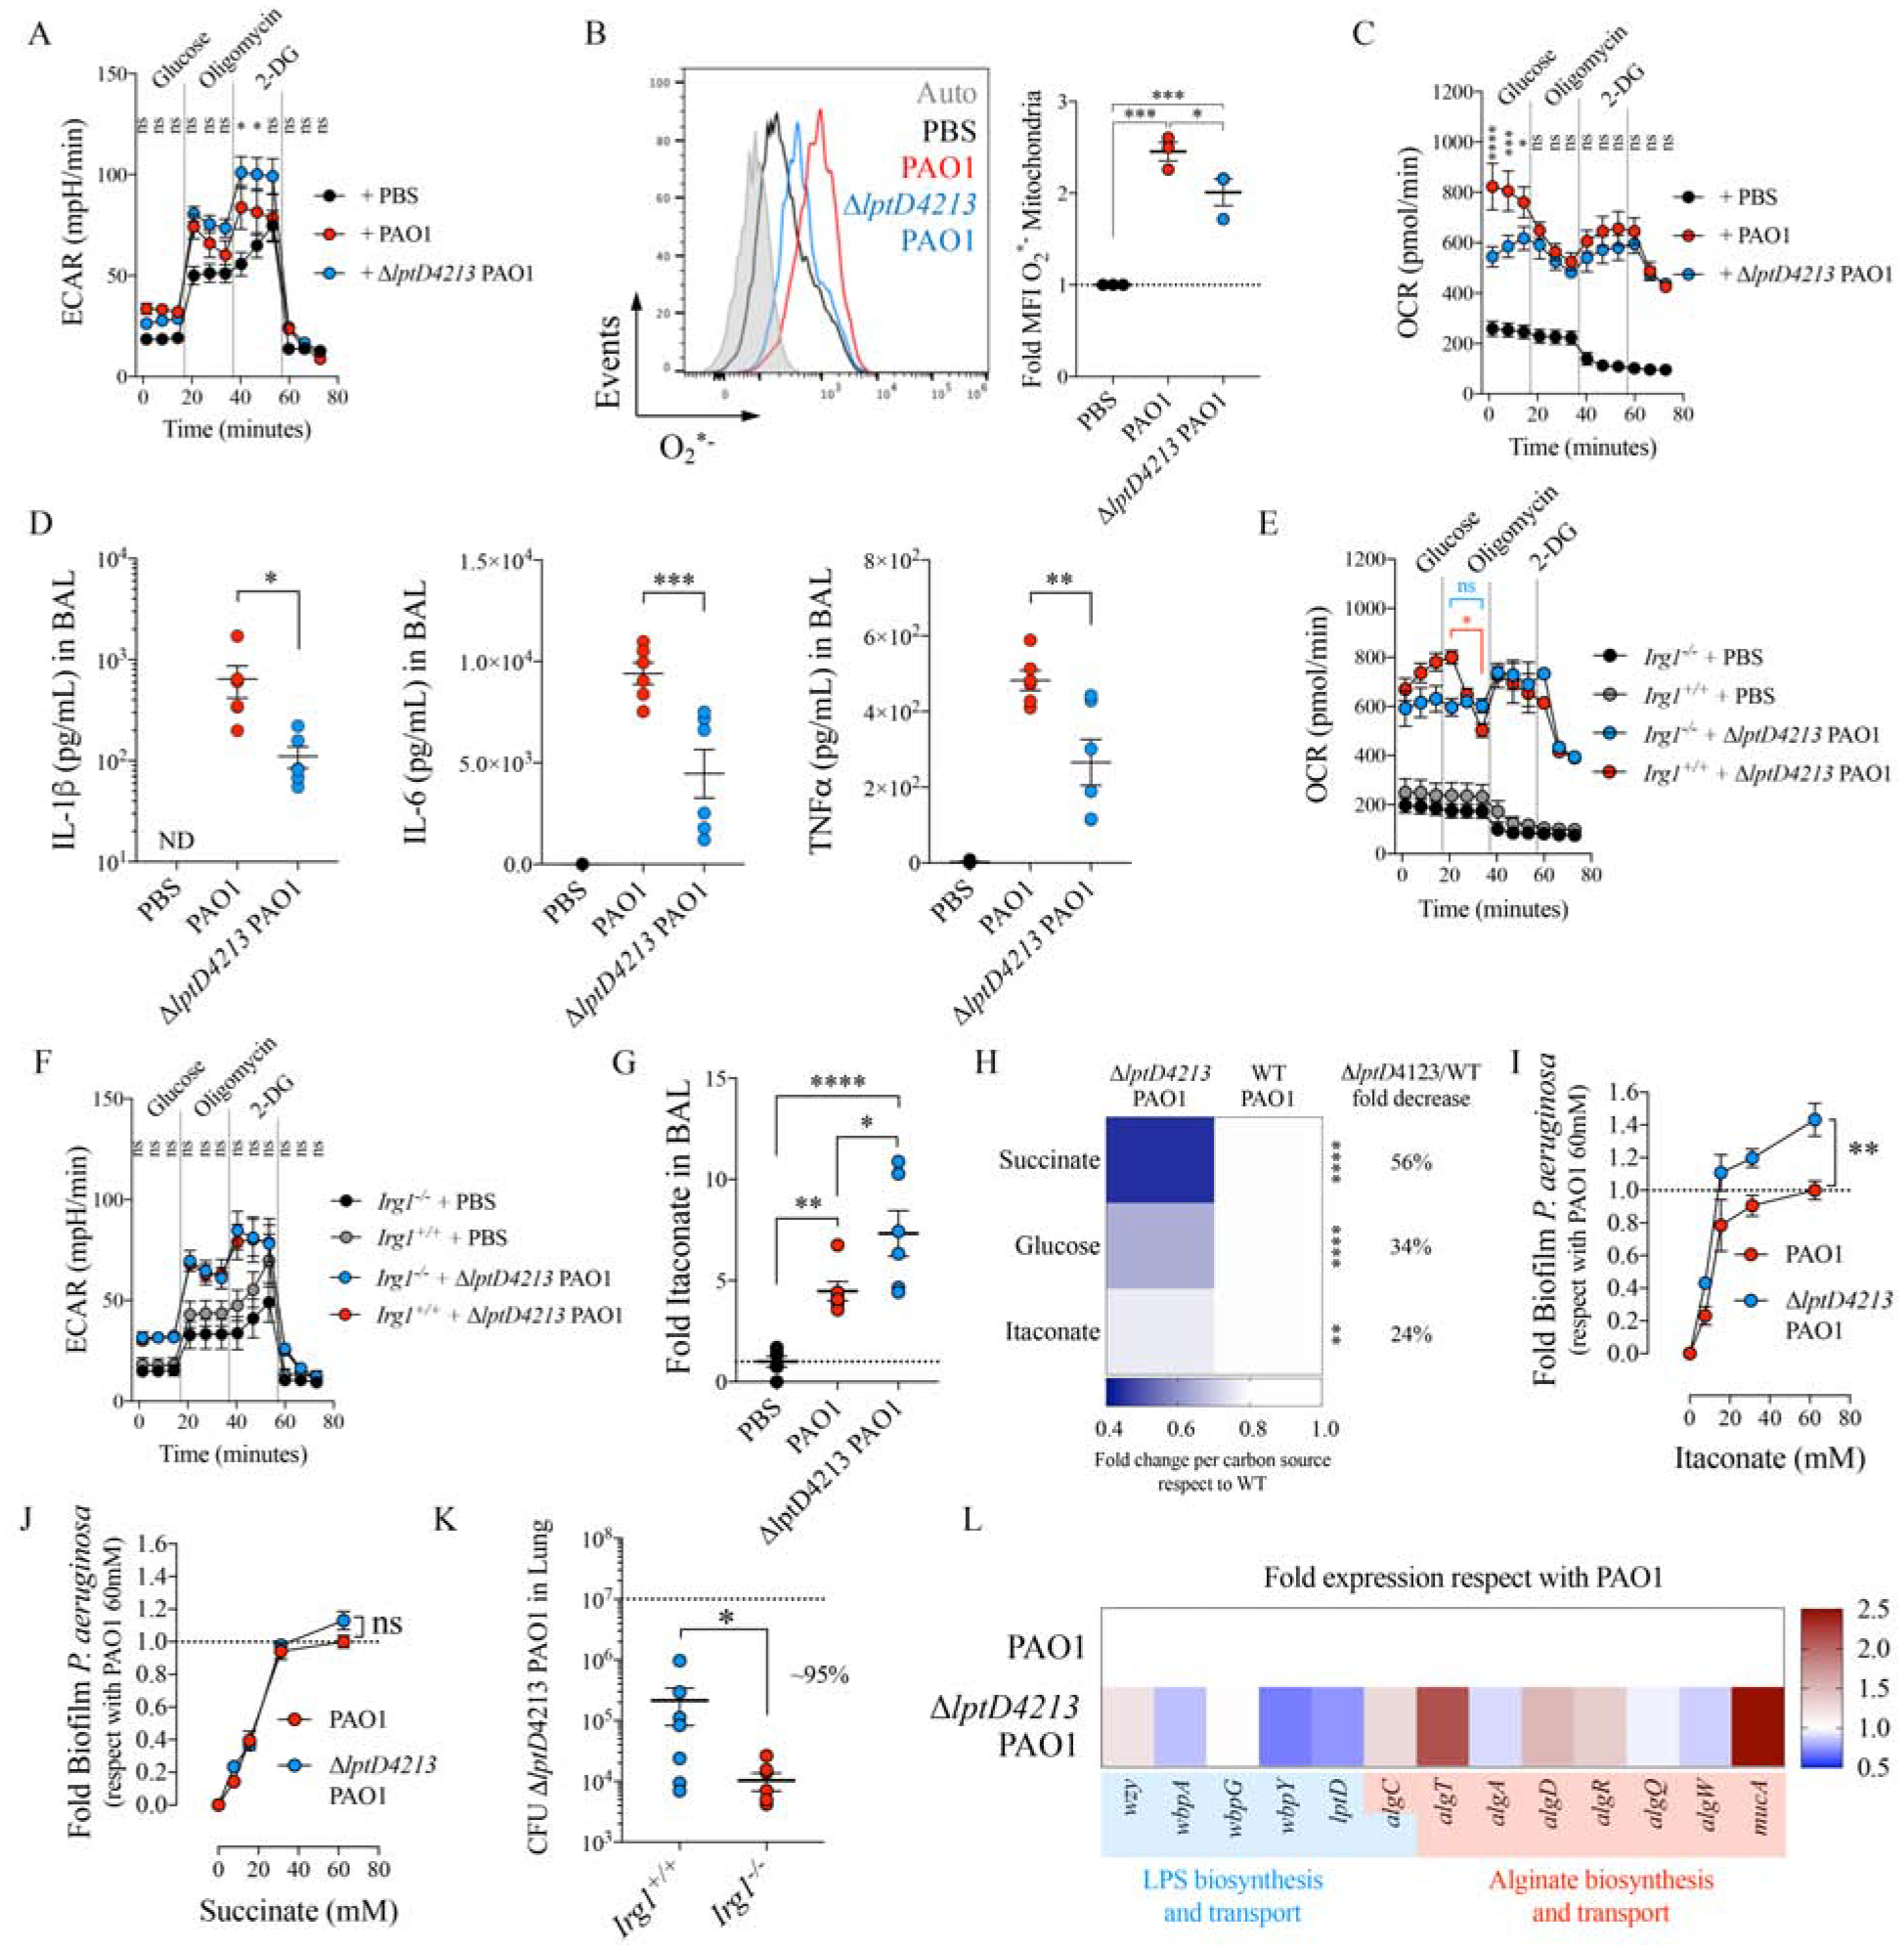
ΔlptD4213 PAO1 induces macrophage itaconate metabolism in the airway.
A-C) Extracellular acidification rates (ECAR) by Seahorse (A), mitochondrial ROS (O2*−) as determined by Mitosox and flow cytometry (B), and oxygen consumption rates (OCR) by Seahorse (C) in mouse BMDMs either uninfected (PBS) or infected with PAO1 or ΔlptD4213 PAO1.
D) Levels of the inflammatory cytokines IL-1β (left), IL-6 (middle) and TNFα (right) in the BAL from uninfected (PBS) or 16h-intranasally infected mice with PAO1 or ΔlptD4213 PAO1.
E-F) The OCR (E) and the ECAR (F) for Irg1+/+ and Irg1−/− BMDMs that were either uninfected (PBS) or infected with ΔlptD4213 PAO1.
G) Mice were infected as in D and itaconate was quantified by Mass Spec in BAL.
H) Respect with WT PAO1, ΔlptD4213 PAO1 fold overnight growth in different carbon sources.
I-J) Crystal violet biofilms produced by PAO1 and ΔlptD4213 PAO1 strains growth in M9 supplemented either with itaconate or succinate.
K) Bacterial burden (CFUs) measured in Irg1+/+ and Irg1−/− lungs of mice infected with ΔlptD4213 PAO1.
L) Fold increase of genes involved in EPS and LPS synthesis in ΔlptD4213 PAO1, in respect to PAO1. Data are shown as average +/− SEM. B, D, G: One-Way ANOVA; K: t-Student; A, C, E-F, I-J: Two-Ways ANOVA. In vivo data are from n = 2 (6–7 mice total). Seahorse were a minimal of n = 3. ****: P < 0.0001; ***: P < 0.001; **: P < 0.01; *: P < 0.05; ns: non-significant. See also Figure S2.