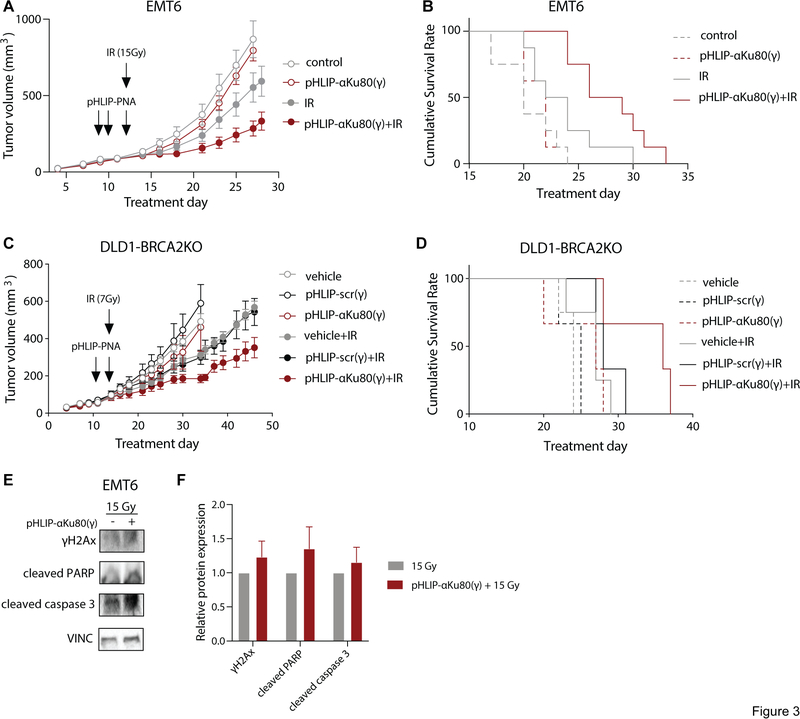
Fig. 3: pHLIP-αKu80(γ) causes tumor radiosensitization in vivo.
(A) Tumor growth curves in control or pHLIP-αKu80(γ) treated EMT6 tumors (5 mg/kg) alone (left) or with local tumor irradiation (1 × 15 Gy, right) (two-way RM-ANOVA, effect of treatment: unirradiated: P = 0.40, irradiated: P < 0.05, n = 8 mice/group). (B) Survival curves in control or pHLIP-αKu80(γ) treated EMT6 tumors (5 mg/kg) with or without local tumor irradiation (1 × 15 Gy) (Log-rank (Mantel-Cox) test, unirradiated: P = 0.54, irradiated: P < 0.05, n = 8 mice/group). (C) Tumor growth curves in DLD1-BRCA2KO tumors treated with vehicle, pHLIP-scr(γ) (5 mg/kg), or pHLIP-αKu80(γ) (5 mg/kg) alone or with local tumor irradiation (1 × 7 Gy) (two-way RM-ANOVA, unirradiated: effect of treatment P = 0.63, n = 3–4 mice/group; irradiated: effect of treatment P < 0.05, vehicle vs. pHLIP-αKu80(γ) P < 0.05, vehicle vs. pHLIP-scr(γ) P = 0.88, n = 3–4 mice/group). (D) Survival curves in DLD1-BRCA2KO tumors treated with vehicle, pHLIP-scr(γ) (5 mg/kg), or pHLIP-αKu80(γ) (5 mg/kg) alone or with local tumor irradiation (1 × 7 Gy) (Log-rank (Mantel-Cox) test, unirradiated: P = 0.27, n = 3–4 mice/group; irradiated: P = 0.08, n = 3–4 mice/group). (E) Representative Western blot of DNA damage and apoptotic markers in control or pHLIP-αKu80(γ) treated EMT6 tumors with local tumor irradiation (1 × 15 Gy) (n = 4 mice/group). (F) Quantification of Western blot data (two-way ANOVA, effect of treatment: P = 0.15, n = 3–4 tumors/group). Data are represented as means ± SEM.

