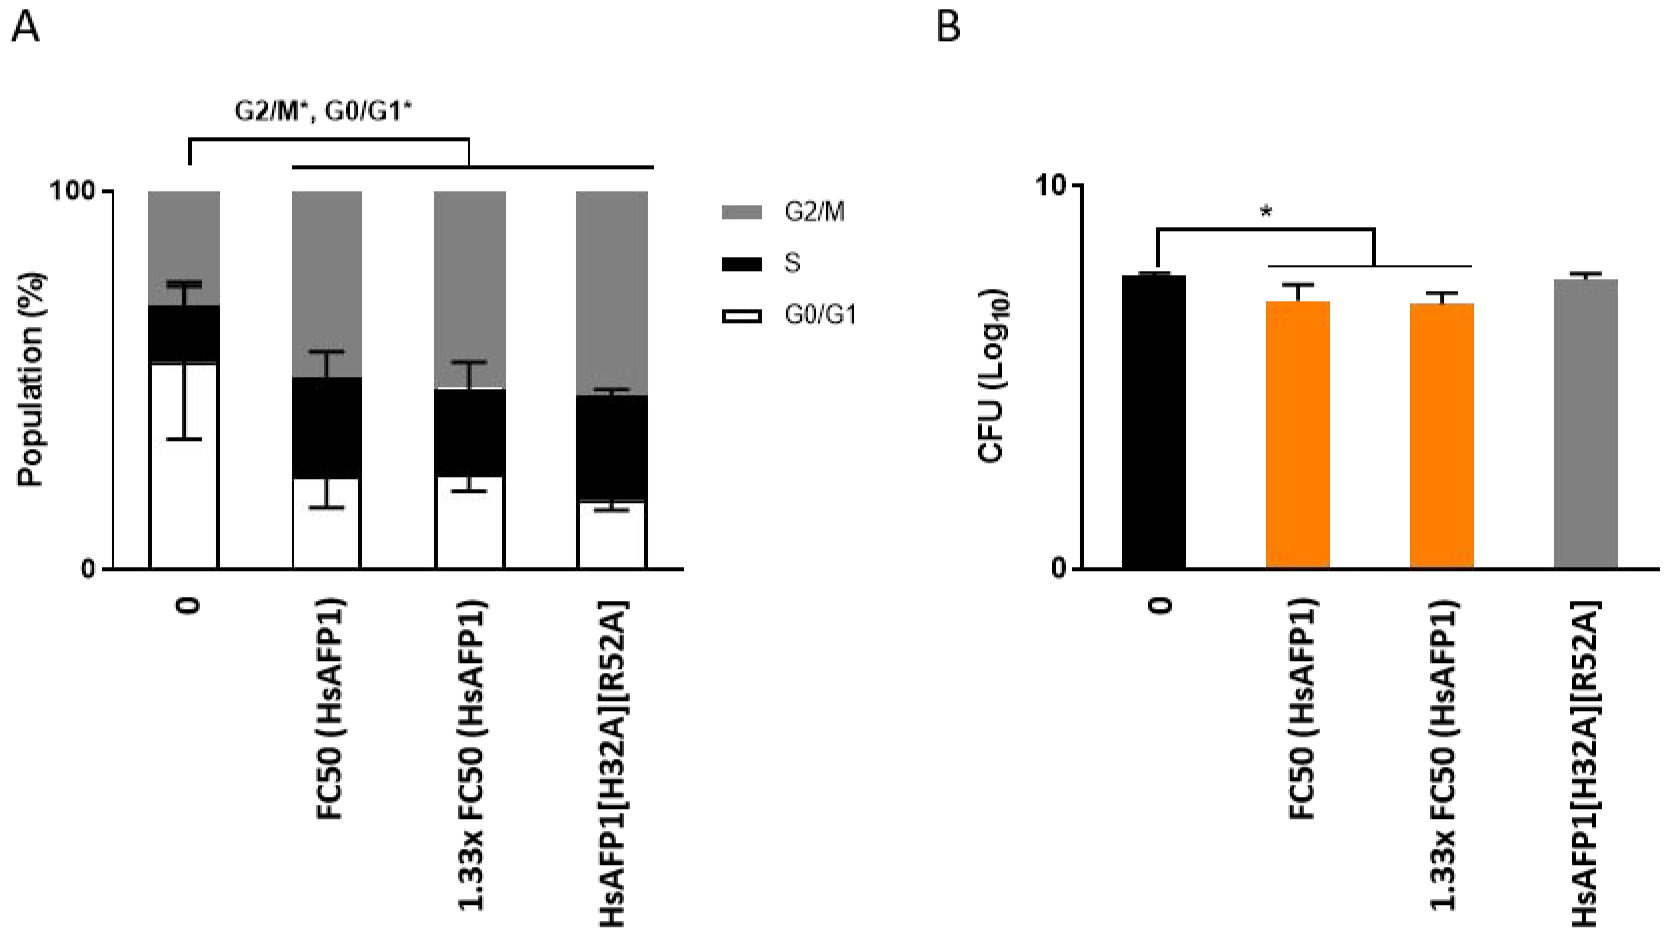
Figure 6: Cell cycle impairment in the G2/M phase is induced by moderate HsAFP1 doses.

S. cerevisiae WT cells treated 180 min with moderate HsAFP1 (FC50; 25 μg/mL and 1.33x FC50; 33.25 μg/mL) or HsAFP1[H32A][R52A] doses (equivalent to the highest tested HsAFP1 dose) in 1/5th PDB/YNB (supplemented with 2% glucose, histidine (50 μg/mL), leucine (300 μg/mL), methionine (50 μg/mL) and uracil (100 μg/mL)) with 50 mM HEPES pH 7 at room temperature. (A) Grey, black and white bars represent the percentage of cells (mean ± SD, for n = 3 independent experiments) in the G2/M-, S-, and G0/G1-phase, respectively. Significant differences in the population size of each phase between the control treatment and all other treatments were determined via two-way ANOVA followed by Tukey multiple comparison, with * representing P < 0.05. (B) The amount of viable cells after treatment with HsAFP1 or HsAFP1[H32A][R52A] was determined via CFU counting. Log10 numbers of CFU ± SD, for n = 3 independent experiments. Significant differences between the control treatment (black bar) and all other treatments were determined via one-way ANOVA followed by Dunnett multiple comparison, with * representing P < 0.05 (presented by orange bars in (B)).
