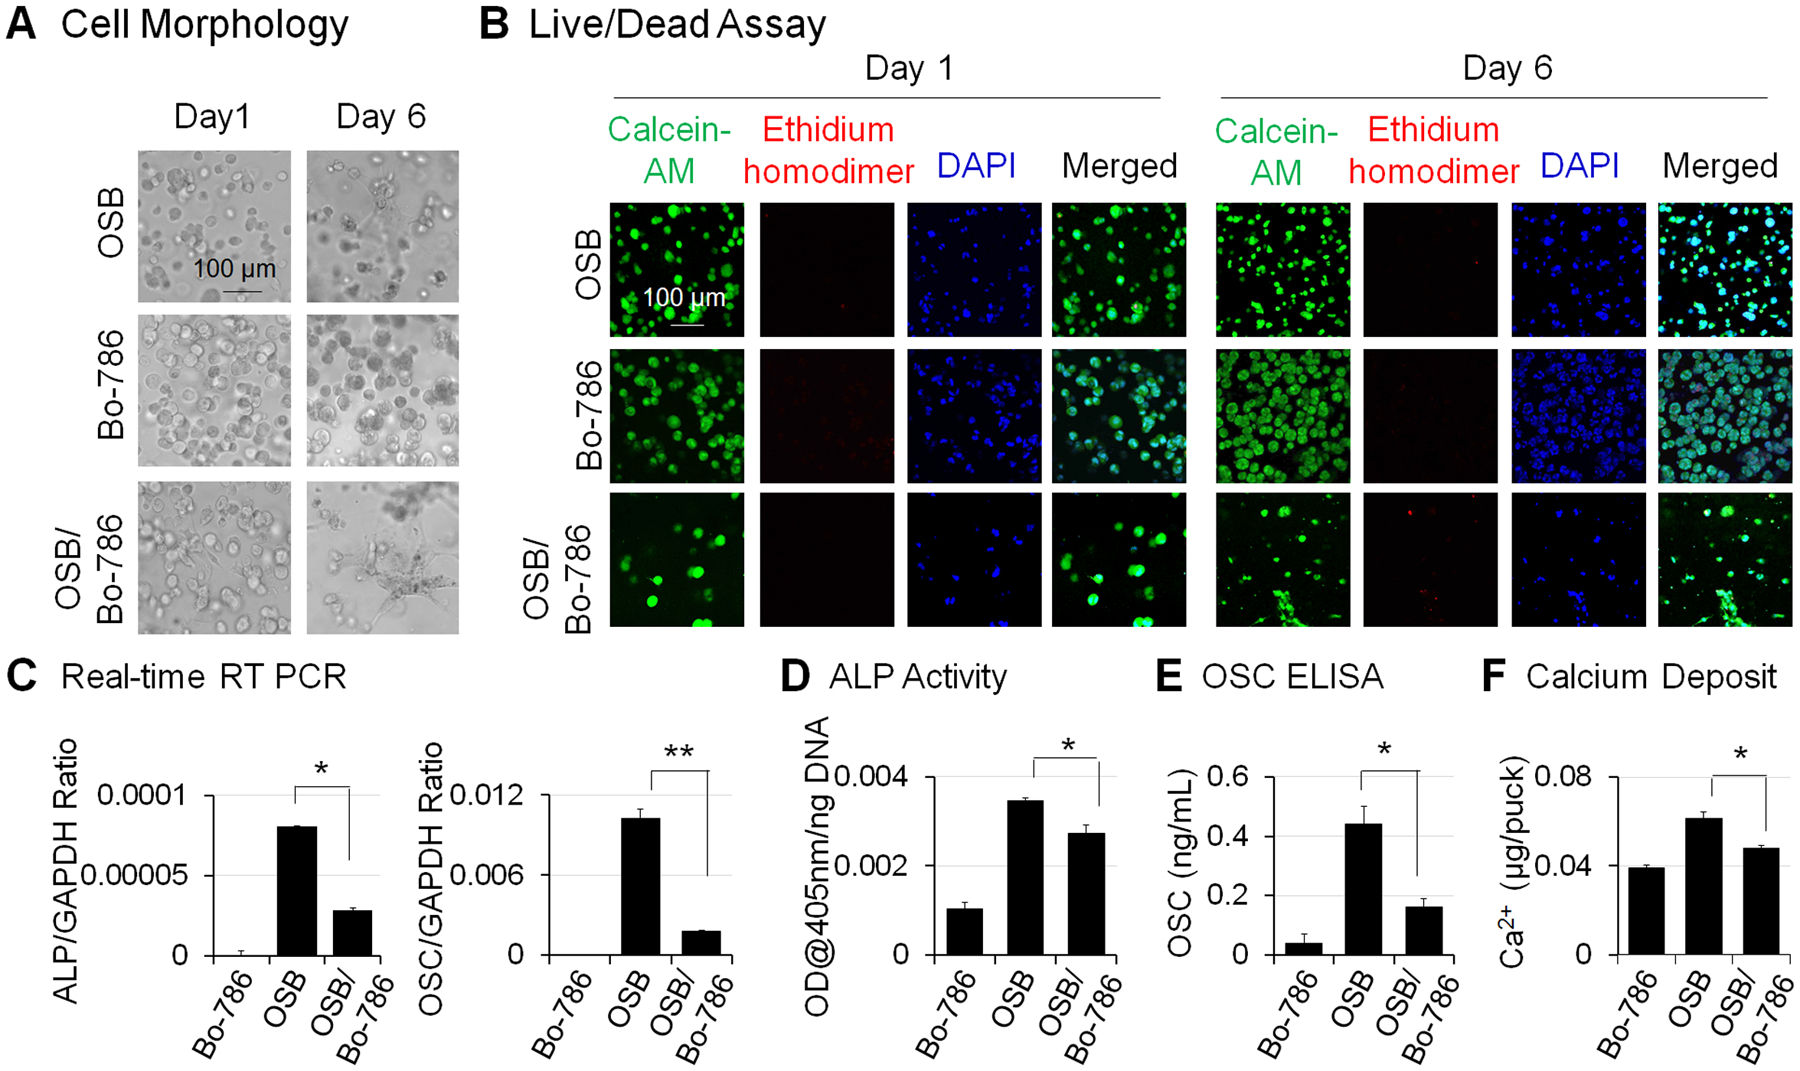
Figure 1. Inhibition of OSB differentiation in 3D co-culture of OSB with Bo-786 cells.

A) Morphology of cells in MC3T3-E1 monoculture (OSB), Bo-786 monoculture (Bo-786), and co-culture of these two cell lines (OSB/Bo-786) in 3D hydrogel on day 1 and day 6. B) Cell viability was determined by LIVE/DEAD viability assay. Green staining by calcein-AM indicates viable cells. Red staining by ethidium homodimer indicates non-viable cells. Blue staining by DAPI indicates nucleus. C) ALP mRNA and OSC mRNA were determined by real-time RT-PCR; D) ALP protein levels were determined by ALP activity assay. E) OSC protein levels were determined using OSC ELISA kit. F) Calcium assay was used to show calcium deposits in the 3D hydrogel. *: P < 0.05; **: P < 0.01 as compared to OSB monoculture.
