
Fig. 5. Distribution of gCNV quality metrics for rare, nonopsin copy-number variations (CNVs).
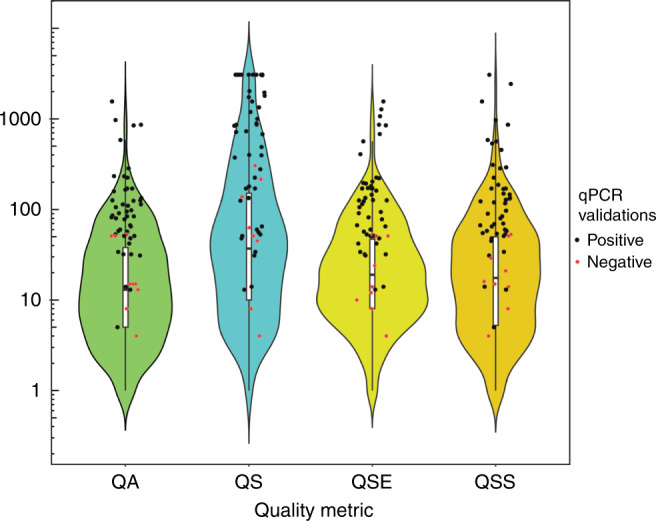
The gCNV algorithm provides four quality metrics for every predicted CNV: QA, QS, QSE, and QSS. QA is the complementary Phred-scaled probability that all points (i.e., targets or bins) in the segment agree with the segment copy-number call. QS is the complementary Phred-scaled probability that at least one point (i.e., target or bin) in the segment agrees with the segment copy-number call. QSE is the complementary Phred-scaled probability that the segment end position is a genuine copy-number changepoint. QSS is the complementary Phred-scaled probability that the segment start position is a genuine copy-number changepoint. Violin plots show the relative probability density of the distribution of each quality metric, while internal box plots show the 25th, median, and 75th percentile of distribution. The red and black data points represent CNVs within the distribution that were experimentally determined to be either true positives (black) or false positives (red) by quantitative polymerase chain reaction (qPCR) validation.