Fig. 3.
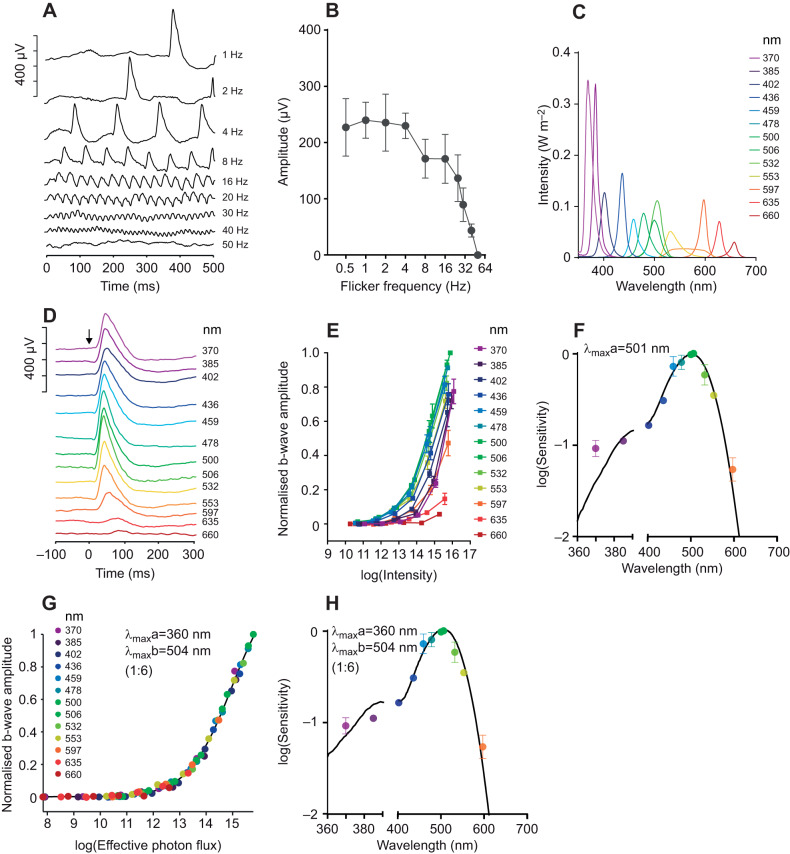
Spectral sensitivity of electroretinogram (ERG) responses to a dark-adapted flash. (A) Representative ERG responses to flicker stimuli of different frequencies. (B) Response amplitude of flicker stimuli of different frequencies (n=3; means±s.e.m.). (C) Spectral power distribution of 13 stimuli used to track spectral sensitivity. (D) Representative flash ERGs for spectral stimuli presented at maximum intensity. (E) Normalised b-wave amplitude for spectral stimuli presented at up to 6 intensities (photons cm−2 s−1; n=3; means±s.e.m.). (F) Mean±s.e.m. EC50 values plotted as a function of wavelength (central peak of each channel). Black line shows the best-fitting spectral sensitivity function (accounting for lens transmission) to describe these data (λmax=501 nm; R2=0.978). Note that 635 and 660 nm data points were excluded given the low sensitivity to these wavelengths. (G) Response amplitude as a function of effective photon flux (photons cm−2 s−1) for the best-fitting nomogram/pair of nomograms. In this case, the best fit was composed of two pigments with λmax of 360 and 504 nm, at a ratio of 1:6. The curve fit has an R2 of 0.999. (H) Spectral sensitivity function of the best-fitting nomogram/pair of nomograms (used to generate the x-axis in G). EC50 values were replotted from F for comparison.

