Fig. 5.

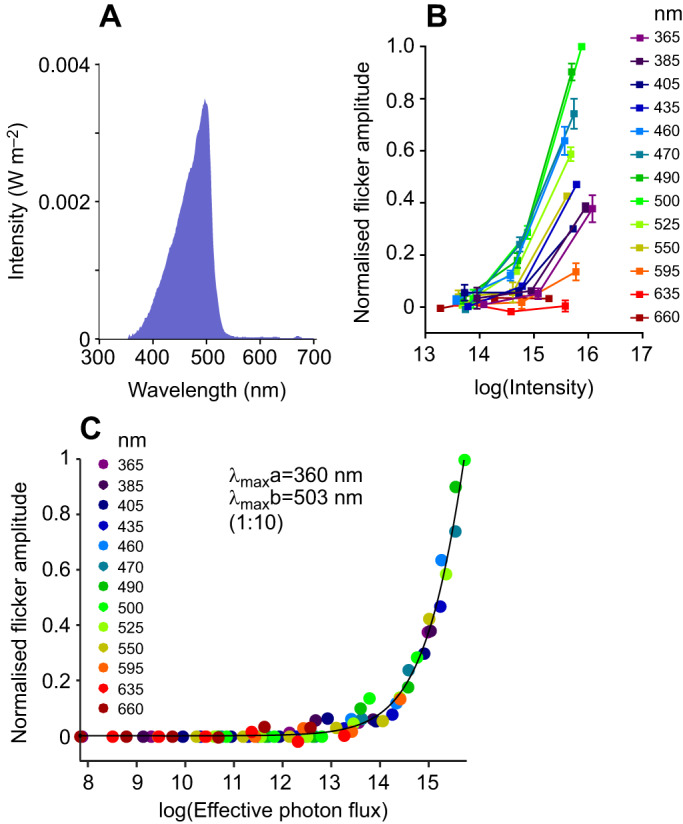
Spectral sensitivity of ERG responses in light-adapted conditions. (A) Spectral power distribution of background light. (B) Normalised response amplitude for 32 Hz flicker, measured across 3 intensities (photons cm−2 s−1) for each spectral stimulus, and in the presence of an adapting background light (n=3; means±s.e.m.). (C) In the presence of background light, response amplitude as a function of effective photon flux (photons cm−2 s−1) was best fitted with a pair of nomograms with λmax of 360 and 503 nm, at a ratio of 1:10 (R2=0.992; n=3).
