Fig. 3.
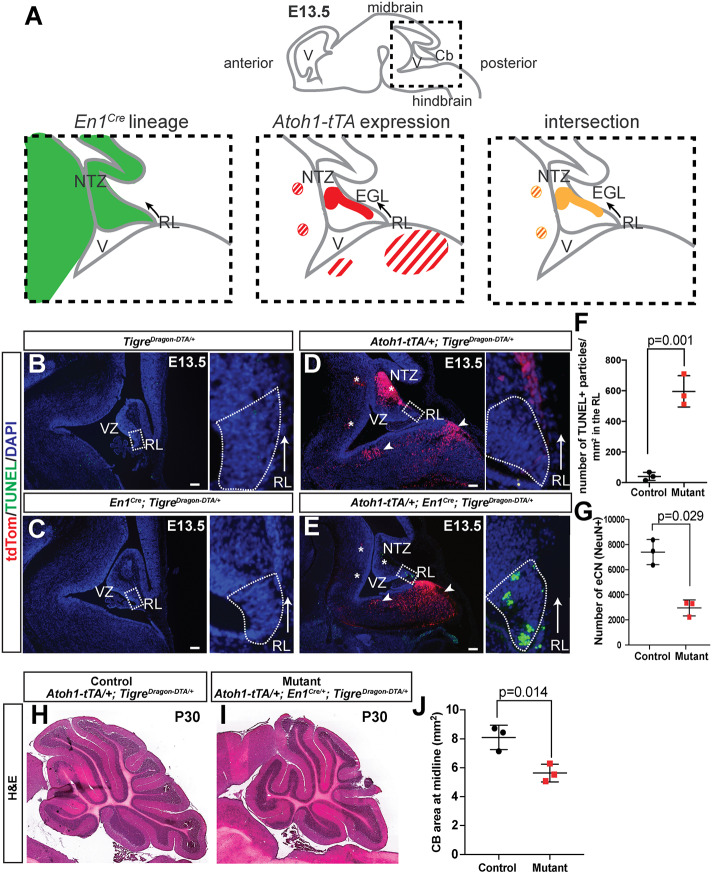
Intersectional capabilities of the TigreDragon-DTA model. (A) Schematic of En1-lineage (based on Sgaier et al., 2007) and Atoh1 expression (based on Machold and Fishell, 2005). Striped regions represent hindbrain nuclei that are outside of the cerebellum. (B-E) Representative sagittal sections showing the cerebellar anlagen at E13.5 in control embryos (either TigreDragon-DTA/+, En1Cre/+; TigreDragon-DTA/+ or Atoh1-tTA/+; TigreDragon-DTA/+) and EC-eCN-DTA embryos, in the absence of Dox. Asterisks indicate the loss of tdTom+ cells in the NTZ and the two hindbrain nuclei targeted by the intersectional approach; arrowheads point to the hindbrain nuclei that are not affected. The boxed areas are shown magnified in the right panels, rotated counterclockwise. These insets show cell death (TUNEL+) in the rhombic lip region (RL). Arrows show the direction of the tangential migration as the cells exit the RL. Dotted lines indicate the RL region. (F) Quantification of cell death in the RL of E13.5 embryos detected by TUNEL (n=3/genotype, P=0.001, Mann–Whitney unpaired test). (G) Quantification of large NeuN+ cells from every other sagittal section from half P30 cerebella shows the number of excitatory cerebellar nuclei in EC-eCN-DTA animals compared with controls (n=3 for both genotypes, P=0.029, Mann–Whitney unpaired test). (H,I) Representative images of the P30 cerebella of EC-eCN-DTA (I) and littermate control (H). (J) Quantification of cerebellar area of midline sections shows reduction in cerebellar area after eCN ablation. TigreDragon-DTA/+ or Atoh1-tTA/+; TigreDragon-DTA/+ animals were used as controls for the quantifications shown in F,G and J. Data are mean±s.d. EGL, external granule layer; NTZ, nuclear transitory zone; RL, rhombic lip; V, ventricle; VZ, ventricular zone. Scale bars: 100 μm.

