Fig. 6.
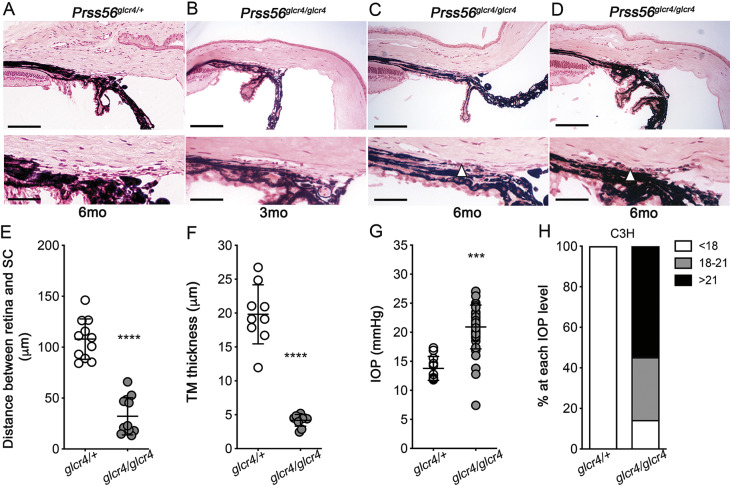
The IOP elevation and ocular drainage structure abnormalities observed in Prss56 mutant mice are genetic context-dependent. (A-D) Representative H&E-stained ocular sections from control C3H.Prss56glcr4/+ (A) and C3H.Prss56glcr4/glcr4 mutant (B-D) mice maintained on a C3H/HeJ genetic background showing that by 6 months of age, Prss56 mutant mice exhibit a hypoplastic TM layer (arrowhead in C and D). (E) Scatter plot showing significant reduction in the distance between the retina and Schlemm's canal in Prss56 mutant mice (Prss56glcr4/glcr4) compared to their control littermates (Prss56glcr4/+). n=11 and 12 eyes for control and mutant mice, respectively. (F) Scatter plot showing TM thickness in 6-month-old Prss56 mutant mice (Prss56glcr4/glcr4) compared to their control littermates (Prss56glcr4/+). n=9-12 eyes/group. (G,H) Scatter plot showing IOP values (G) and histogram showing the proportion of eyes in each IOP range (H) for control (C3H.Prss56glcr4/+) and Prss56 mutant (C3H.Prss56glcr4/glcr4) mice maintained on the C3H/HeJ genetic background aged between 3 and 5 months. IOP values were significantly higher in Prss56 mutant mice compared to control mice. n=9 Prss56glcr4/+ and n=10 Prss56glcr4/glcr4 eyes in E; n=11 Prss56glcr4/+ and n=12 Prss56glcr4/glcr4 eyes in F; n=11 Prss56glcr4/+ and n=42 Prss56glcr4/glcr4 eyes in G and H. Data are mean±s.d. ***P<0.001, ****P<0.0001, Student's t-test. Scale bars: 100 µm (top panels); 40 µm (lower panels).

