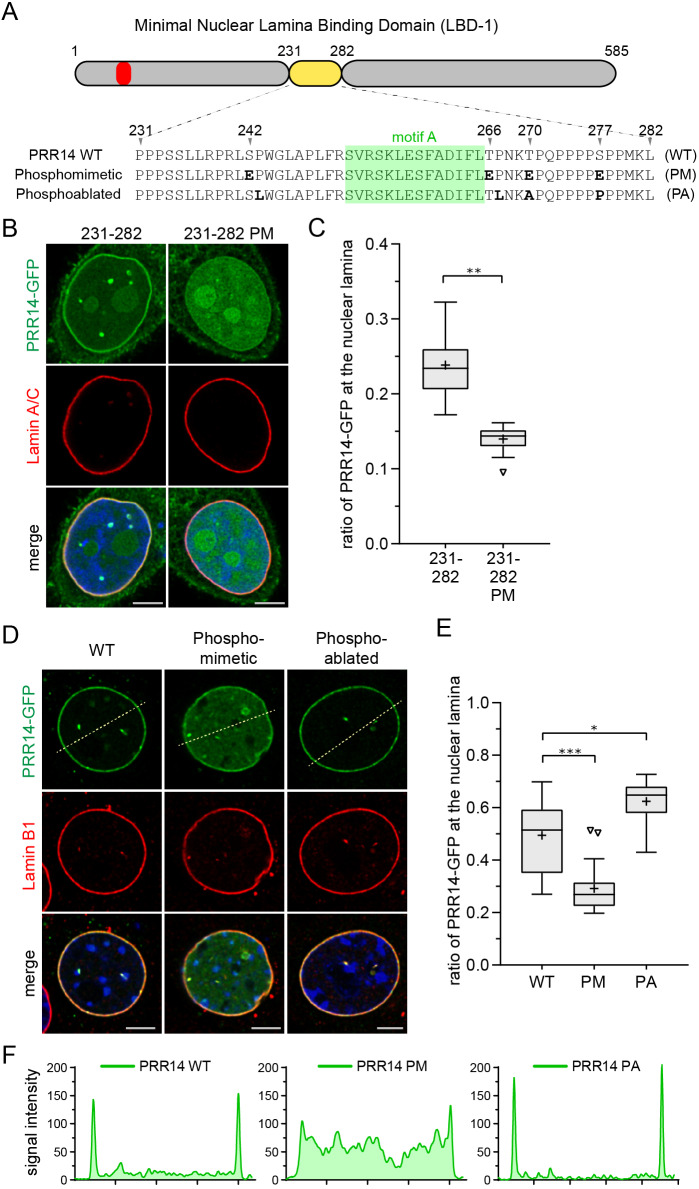
Fig. 5.
LBD phosphomimetic and phosphoablation substitutions affect PRR14–nuclear lamina association. (A) Diagram and sequence of the human PRR14 231–282 LBD highlighting serine/threonine [S/T]P phosphorylation sites at positions 242, 266, 270 and 277 in wild type (WT). Phosphomimetic (PM) and phosphoablation (PA) substitutions are shown. The LAVVL HP1/heterochromatin-binding motif (52–56) is shown in red. (B) Representative confocal images of HeLa cells expressing the GFP-tagged PRR14 LBD (231–282) with phosphomimetic (PM) glutamic acid substitutions, showing loss of nuclear lamina localization. (C) Box plot demonstrating the proportion of indicated PRR14-GFP proteins from panel B at the nuclear lamina compared to the total nuclear signal, calculated using Lamin A/C signal as a mask. Boxes indicate the interquartile range with the median represented by a horizontal bar. Whiskers are drawn using the Tukey method and + indicates the mean value. n=20 cells per condition. (D) Representative confocal images of C2C12 cells expressing phosphomimetic (PM) and phosphoablation (PA) mutants of GFP-tagged full-length PRR14. Dashed lines indicate line sections quantified in F. (E) Box plot demonstrating the proportion of the indicated PRR14–GFP proteins from panel D at the nuclear lamina compared to the total nuclear signal, calculated using the Lamin B1 signal as a mask. Boxes indicate the interquartile range with the median represented by a horizontal bar. Whiskers are drawn using the Tukey method and + indicates the mean value. n=20 cells per condition. (F) Line signal intensity profiles corresponding to dashed lines in panel D. ***P<0.001; **P<0.01; *P<0.05 (one-way ANOVA with Dunn's multiple comparison test). Scale bars: 5 µm.

