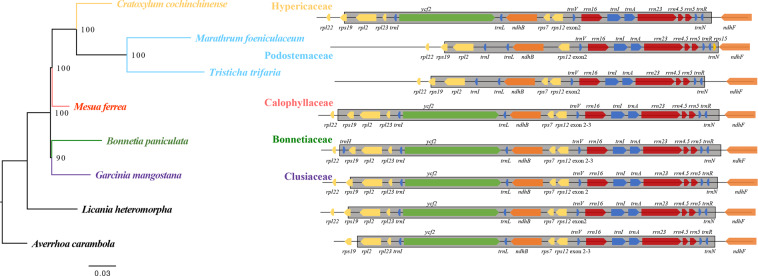
Figure 1.
The plastid phylogeny of the clusioid clade. Maximum-likelihood (ML) tree inferred from the 82-gene (76 protein-coding and 4 rRNA genes) matrix. The number at each node indicates the ML bootstrap values. Species in the clusioid clade were color-coded according to family. A part of their plastome organization is shown on the right. The gray blocks indicate the IR regions. Gene lengths are not to scale. Gene arrow tips indicate the direction of transcription.

