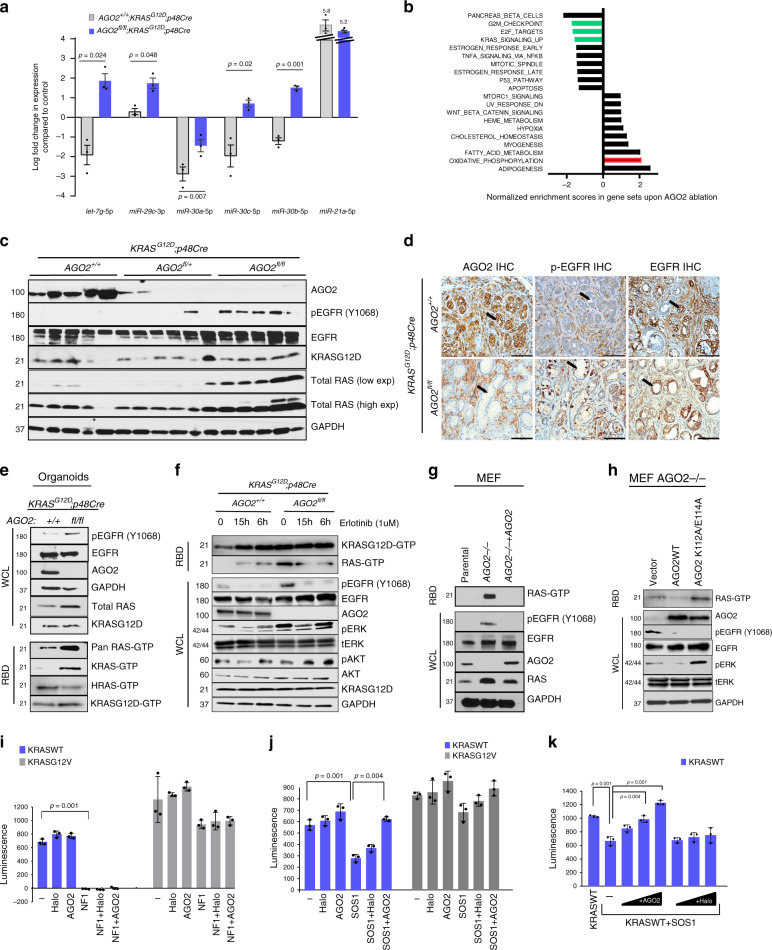
Fig. 6. AGO2 modulates microRNAs and limits RAS activation to control OIS.
a Plot showing relative expression of microRNAs from pancreata obtained from three mice from each of the indicated genotypes at the 500-day time point. Log fold change values were generated relative to microRNA expression in three p48Cre mice (used as reference). Two sided t-tests were performed to determine the P value and error bars are mean values +/− SEM. b GSEA (Gene Set Enrichment Analysis) of transcriptional changes significantly enriched (FDR value < 0.05) in pancreatic tissue. Green and red bars represent relevant gene sets discussed in the main text. c Immunoblot analysis from individual pancreata obtained from 12-week-old mice of the indicated genotypes. d Representative images of IHC analysis in PanINs of 12-week-old mice in the indicated genotypes. Arrows indicate PanINs. Scale bar, 100 µm. e Immunoblot analysis of pancreatic ductal organoids obtained from 12-week-old AGO2+/+;KRASG12D;p48Cre and AGO2fl/fl;KRASG12D;p48Cre mice. Total RAS-GTP was determined using the RAF binding assay (RBD) followed by immunoblotting with indicated antibodies. f Immunoblot analysis of pancreatic organoids upon treatment with erlotinib at 6 h and 15 h time points. g Immunoblot analysis of parental, AGO2−/−, and AGO2−/− + AGO2 mouse embryonic fibroblasts (MEF). RAS-GTP levels were determined by the RAF binding assay. h Immunoblot analysis of AGO2−/− MEFs stably expressing vector, wild-type AGO2, and AGO2K112A/E114A. i Full-length wild-type KRAS and KRASG12V proteins were incubated with NF1-GTPase activating protein (GAP) or j SOS1 (guanine exchange factor) in the presence or absence of AGO2, and the levels of free GTP were analyzed (as a luminescence-based readout for GTP hydrolysis). Halo protein was used as a control. k Wild-type KRAS was incubated with SOS1 in the presence of increasing concentrations of either AGO2 or Halo protein prior to measurement of free GTP levels. Significance was assessed in (i–k) using Welch’s two tailed test to determine p values. In relevant panels of this figure, data are presented as mean values +/− SEM. Numbers on the left of the immunoblots in this figure indicate protein molecular weights in kDa.

