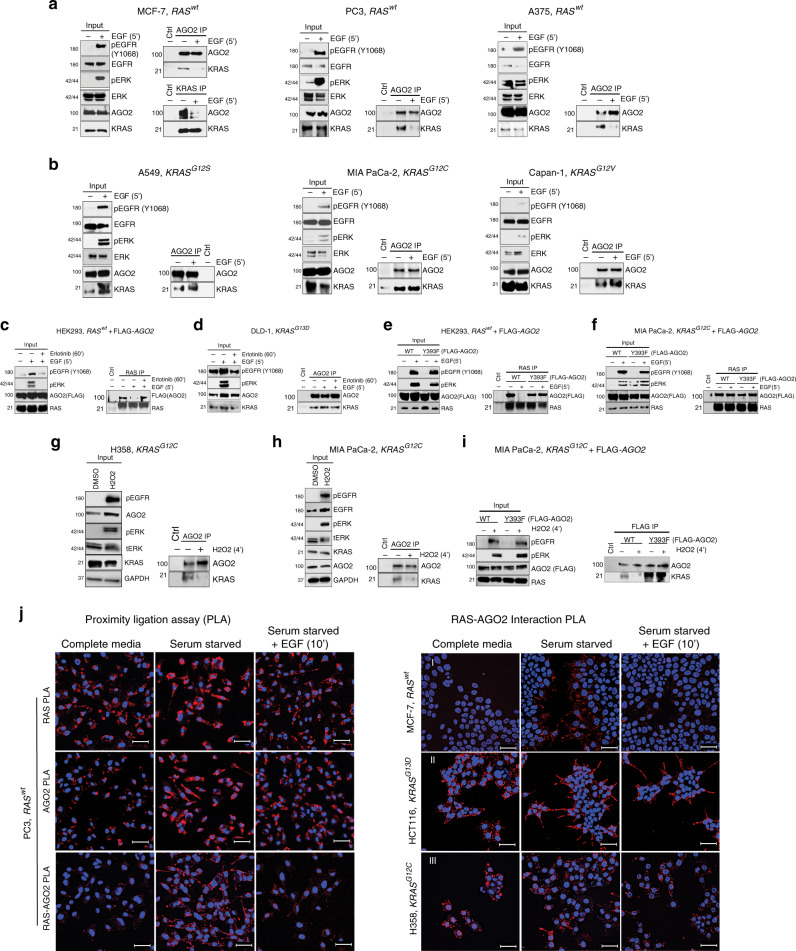
Fig. 7. Phosphorylation of AGO2Y393 disrupts its interaction with KRAS.
a Immunoprecipitation (IP) of endogenous AGO2 upon EGF stimulation (5′) in the indicated cancer cells expressing wild-type RAS followed by immunoblot analysis of KRAS. For MCF7 cells, endogenous co-IP analysis was performed using both AGO2 and KRAS-specific antibodies. For each cell line and panel in this figure, MAPK activation and levels of various proteins are shown as input blots. b IP of endogenous AGO2 upon EGF stimulation (5′), in the indicated cancer cells harboring different KRAS mutations, followed by immunoblot analysis of KRAS. c Co-IP and immunoblot analysis of RAS and AGO2 upon EGF stimulation of HEK293 (wild-type KRAS) cells expressing FLAG-AGO2 or (d) DLD-1 (KRASG13D) cells in the presence or absence of erlotinib. e EGF stimulation and RAS co-IP analysis in HEK293 (wild-type KRAS) and f MIA PaCa-2 (KRASG12C) cells expressing FLAG-tagged AGO2 (wild-type or Y393F). IP of endogenous AGO2 upon H2O2 treatment (4′), in H358 (g) and MIA PaCa-2 (h) cells harboring KRAS mutations, followed by immunoblot analysis of KRAS. i H2O2 treatment and KRAS-AGO2 co-IP analysis in MIA PaCa-2 (KRASG12C) cells expressing FLAG-tagged AGO2 (wild-type or Y393F). Numbers on the left of the immunoblots in this panel indicate protein molecular weights in kDa. j Left panels, Representative images of single target (RAS or AGO2) and RAS-AGO2 interaction PLA in wild-type RAS expressing PC3 cells across the indicated cell culture conditions. Right panels, Representative images of PLA to detect RAS-AGO2 interaction in wild-type RAS expressing MCF-7 (panel I) and oncogenic KRAS expressing HCT116 (panel II) and H358 (panel III) cells grown in the indicated culture conditions. PLA signals appear as red dots around DAPI stained nuclei in blue. Scale bar, 50 µm.

