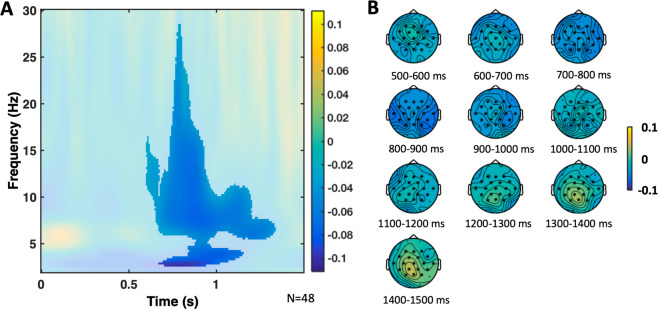
Figure 8.
DM TF effect cluster. (A) Relative power change of the DM TF effect averaged across the significant electrodes found in the cluster. The significant time window was approximately from 600 ms to 1300 ms, and the significant frequency window was from 6 Hz to 28 Hz. The difference between the remembered minus the forgotten condition was contrasted in the cluster analysis, including both the young and older groups. For the figure, the mean was calculated from the grand averages across the 19 electrodes (F3, Fz, F4, FC5, FC1, FC2, FC6, T7, C3, Cz, C4, T8, CP5, CP1, CP2, CP6, P3, Pz, P4) of the cluster. (B) TF power topoplots of the significant cluster of the DM effect, in the significant TF window. Electrodes in the cluster are highlighted with asterisks.

