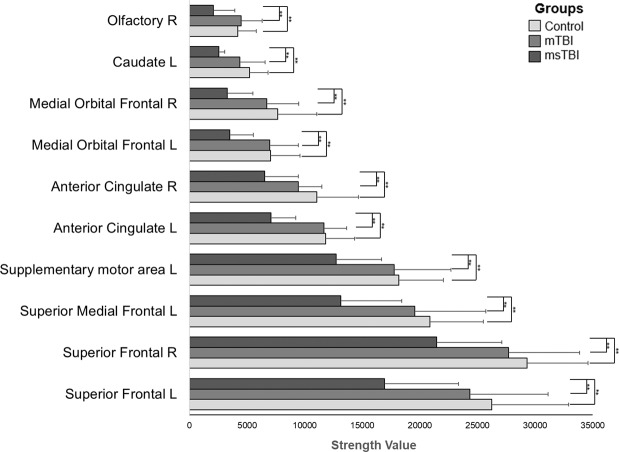
Figure 4.
Group differences in local strength in all brain regions. Comparison between mTBI group (n = 12), msTBI group (n = 10) and control group (n = 22) in all brain regions (n = 90) using ANOVA (corrected for multiple comparisons) revealed significant differences between healthy controls and msTBI within 10 regions, with more severe injury associated with a greater decline in network strength. R, right; L, left; mTBI, mild traumatic brain injury; msTBI, moderate-severe traumatic brain injury.

