Figure 3.
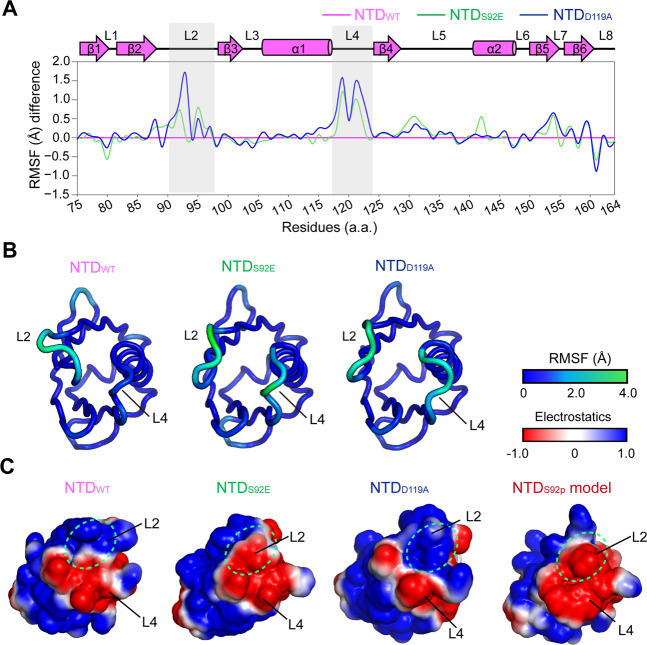
Structural dynamics and electrostatic surface charges in MCU NTDWT and mutants. (A) Ensemble refinements of MCU NTDWT (magenta; PDB ID: 4XSJ), MCU NTDS92E (green), and MCU NTDD119A (blue). Plots of the root-means-square fluctuation (RMSF) (Å) difference. The RMSF of each mutant, S92E (green) and D119A (blue), were relatively calculated by subtracting RMSF of the WT (magenta). Dramatic RMSF difference of the L2-L4 loops are highlighted in gray boxes. The β-strands (β1 − β6), α-helices (α1, α2), and loops (L1 − L8) are shown in arrows, cylinders, and lines, respectively. (B) Cartoon diagrams of ensemble refinements of MCU NTDWT, MCU NTDS92E, and MCU NTDD119A in the RMSF (Å) coloured from blue (rigid) to green (flexible), depended on scoring of the residue dynamics. (C) Electrostatic surface charges of MCU NTDWT and the mutants, S92E and D119A, and MD simulated MCU NTDS92p model were calculated using PDB2PQR server with the CHARMM force field at the mitochondrial matrix pH of approximately 7.8, and the surface diagrams were generated using PyMOL software. The different surface charge regions are highlighted in green circles.

