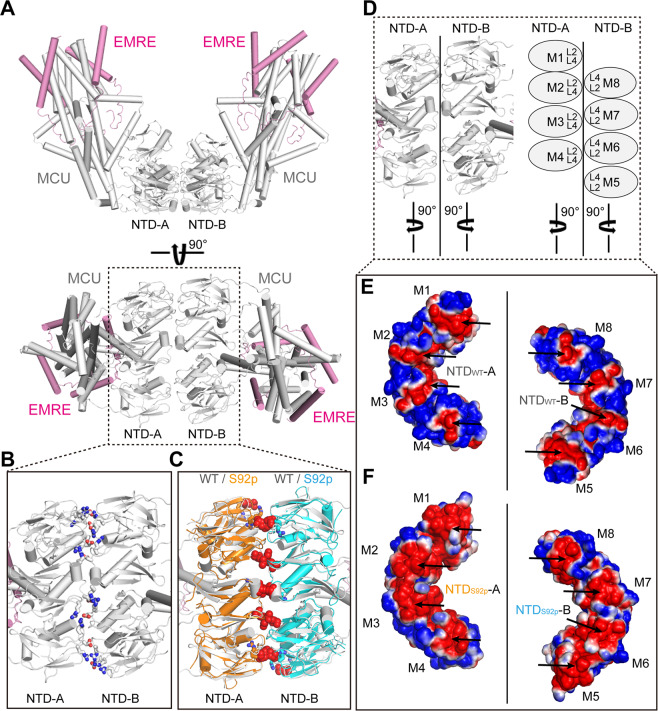
Figure 5.
Structural comparison between the NTDWT and the NTD S92-phosphorylated (NTDS92p) model in the dimerization of two MCU-EMRE channels. (A) The overall structure of two MCU-EMRE channels (PDB ID: 6O58). MCU and EMRE are shown in grey and magenta colored ribbons, respectively. (B) Detailed view of the interacting surfaces of NTD-A and NTD-B in dimer of the two MCU-EMRE channels. The residues (R93, D123, and R124) forming salt bridges and hydrogen bonds are shown in sticks. (C) Detailed view of the superimposed MCU NTDS92p MD simulated model structures (10-nsec snapshot) onto NTDWT-A or -B of the two MCU-EMRE channel complexes. The MCU NTDS92p residues that are expected to disrupt salt bridges and hydrogen bonds (R93, D123, and R124) are depicted as orange sticks and cyan sticks, respectively. Atomic clashes between NTD-A and NTD-B of the MCU NTDS92p are denoted by red spheres. (D‒F) Differences between the electrostatic surface charges of the interacting interfaces of the MCU NTDWT -A or -B (M1‒M8) superimposed on the MCU NTDS92p -A or -B (M1‒M8). Enhancement of negative charges in the MCU NTDS92p are highlighted with black arrows. Blue surfaces and red surfaces in the NTDWT and in the MD simulated NTDS92p indicate positive and negative charges, respectively.

