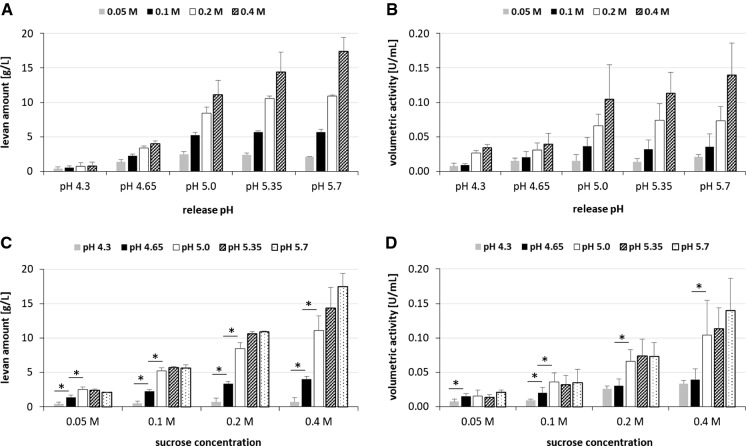
Fig. 5.
Produced levan amounts A, C at the pH of levansucrase release (pH 4.3, 4.65, 5.0, 5.35, 5.7) using four different sucrose concentrations (0.05, 0.1, 0.2, 0.4 M) and the corresponding volumetric activities B, D determined after 24 h of levan production using three different main cultures (OD 2.63, OD 2.77, OD 3.0). Mean values (n = 3) including standard deviations (SD) were calculated from singly detemined values per cell culture and specific condition (pH and sucrose concentration), respectively. Stars indicate significant differences (p < 0.05) between the compared conditions (marked by lines)

