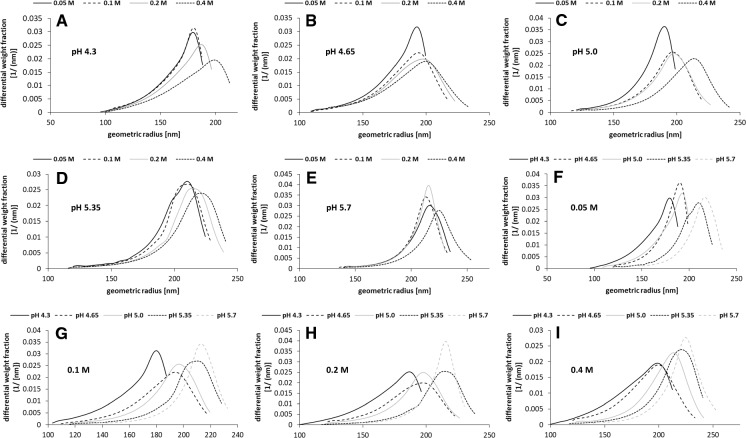
Fig. 6.
Differential weight distributions of geometric radii of levans produced at different pH (pH 4.3, 4.65, 5.0, 5.35, 5.7) and sucrose concentrations (0.05, 0.1, 0.2, 0.4 M). The experimentally determined production pH values derived from the respective buffer mixtures are depicted in brackets in Fig. 1. Data are exemplarily shown for the cell culture OD (600 nm) = 2.77 of G. albidus TMW 2.1191 and were highly similar for OD 2.63 and 3.0 (data not shown), respectively

