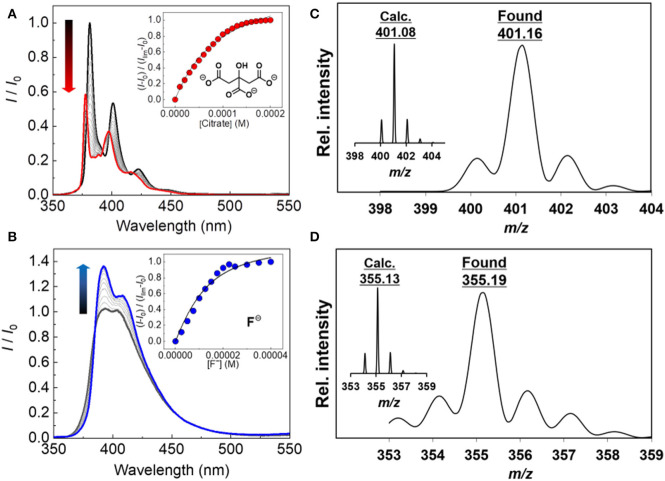
Figure 2.
Fluorescence spectra of (A) 1 in DMSO upon addition of citrate at 25°C (0–200 μM) and (B) 2 in DMSO upon addition of fluoride at 25°C (0–40 μM). [1] = [2] =10 μM, λex = 340 nm for 1 and 2. ESI-MS spectrum (negative) of (C) the 1–citrate complex (inset: calculated isotope pattern for C22H14), and (D) the 2–fluoride complex (inset: calculated isotope pattern for C23H17).

