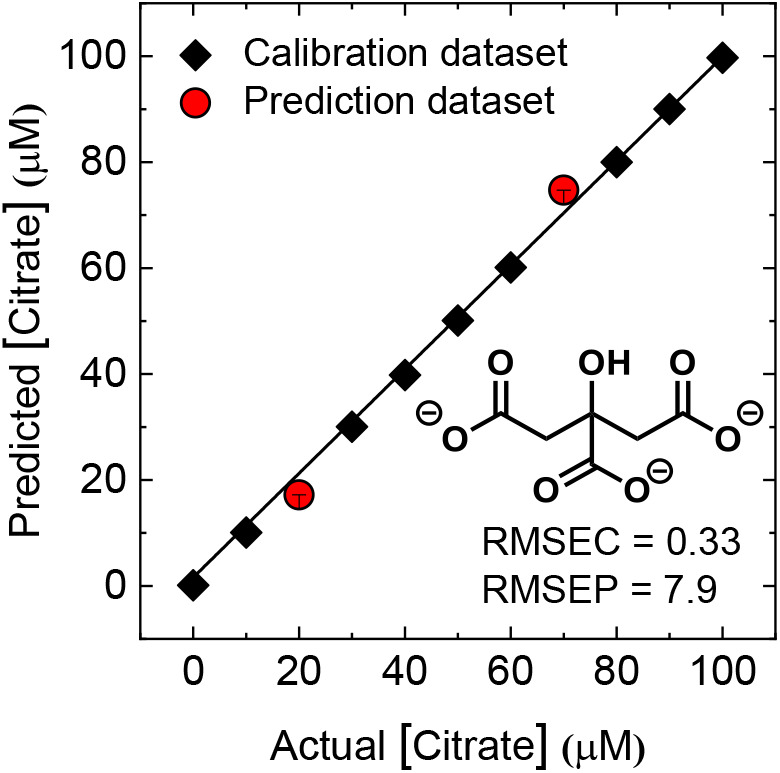
Figure 5.

The results of the regression analysis for quantitative analysis of citrate in mixtures of oxyanions (oxalate, citrate, and malonate). The data were obtained by using the probes 1 and 2. The detailed concentration conditions are summarized in Supplementary Material. Plots of actual vs. predicted concentrations show high accuracy of prediction for multiple concentrations of each analyte. The values of root-mean-square error (RMSE) of calibration (C) and prediction (P) prove the high quality of the model and prediction.
