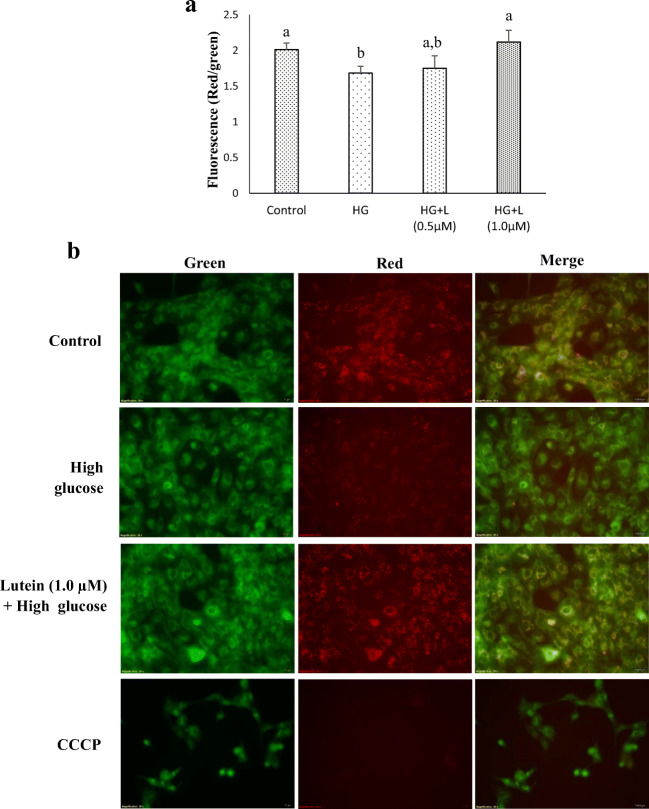
Fig. 4.
Effect of lutein on mitochondrial membrane potential (MMP) in ARPE-19 cells. The MMP was analyzed in ARPE-19 cells treated with lutein (0.5 μM & 1 μM) for 3 h followed by glucose (25 mM) for 24 h using a JC-10 assay kit as indicated in materials and methods. a The quantitative analysis of MMP in the respective treatment group. Values are mean ± SD (n = 3); Bars with different letter indicate significant difference (p < 0.05) between the group. b The fluorescence images of MMP in the respective treatment group

