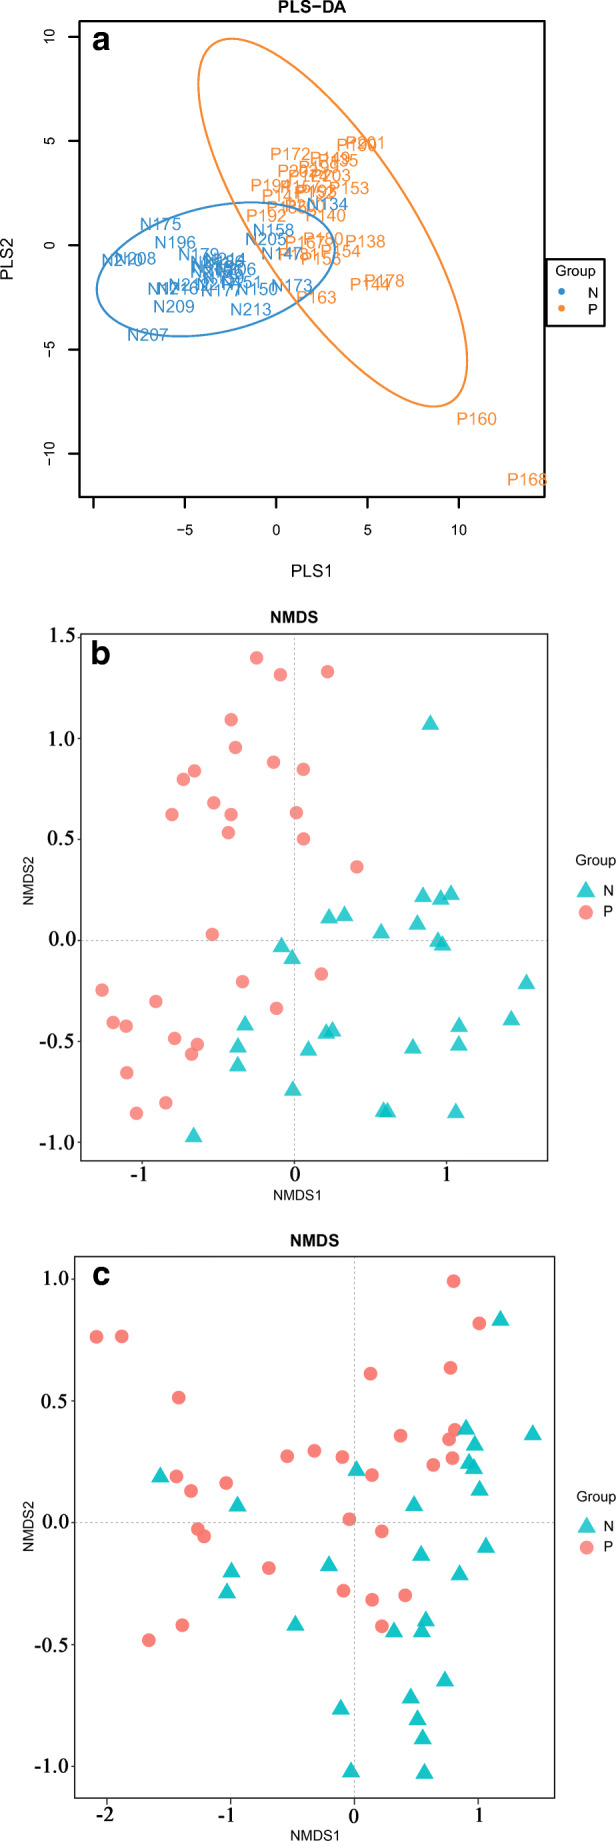
Fig. 1.

Comparisons of the phylogenetic structure and composition between the microbial communities of patients with GCP (Group P) and healthy controls (Group N). Statistical significance was examined using the Adonis method with 999 permutations. a Partial least squares discriminant analysis (PLS-DA) consisted of a supervised model to reveal microbiota variation among groups. The results demonstrated that the sample grouping model was discriminatory. b Nonmetric multidimensional scaling (NMDS) based on unweighted UniFrac distances for bacterial communities between the two groups, P = 0.001. c NMDS based on weighted UniFrac distances between the two groups, P = 0.002
