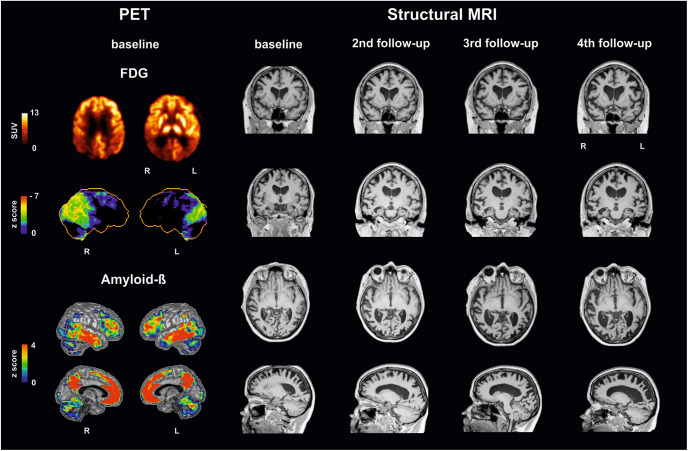
FIGURE 1.
Multimodal imaging findings in a patient with posterior cortical atrophy at baseline and follow-up investigations. (Left) Positron emission tomography (PET) with F18-fluorodesoxyglucose (FDG-PET) reveals decreases in glucose metabolism: upper row in the patient (SUV standardized uptake value), second row compared to a healthy control cohort using NEUROSTAT/3D-SSP software (https://neurostat.neuro.utah.edu). Bottom rows show amyloid-beta accumulation in patient’s individual F18-florbetaben PET scan compared to a healthy control cohort using Hermes BRASS software (Hermes Medical Solution, Stockholm, Sweden). (Right) Structural magnetic resonance imaging (MRI), T1 sequence, illustrating atrophy. Note that Capgras delusion was firstly evident between third and fourth follow-up. L, left; R, right.

