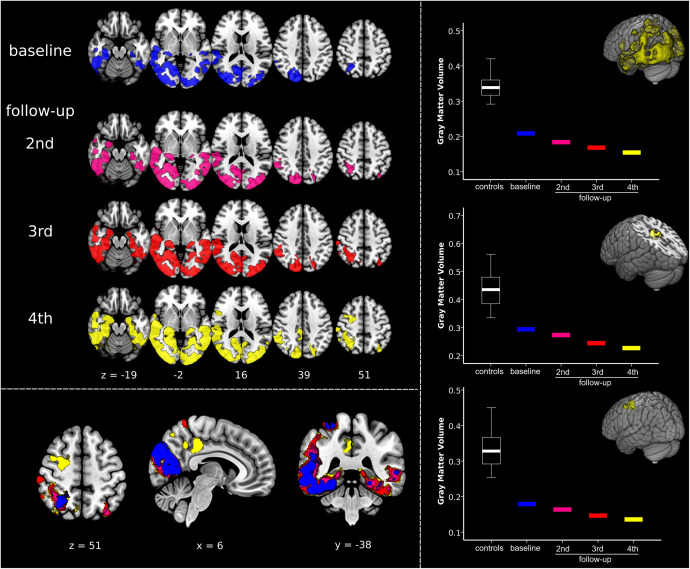
FIGURE 2.
Quantifying dynamic structural imaging changes in single-subject voxel-based morphometry analysis. (Left) Top panel displays results of the voxel-based morphometry analysis showing, at each timepoint, the impairment in gray matter volume (GMV) in the patient compared to a normative elderly healthy control group. Bottom panel shows overlay of patient’s atrophy across the four timepoints, clearly displaying disease progression over time. The same results are presented in Supplementary Video S3. (Right) Results of the regions-of-interest (ROI) analysis illustrating atrophy progression (GMV decline). The upper graph is related to the progression of the disease in the overall disease-specific pattern, i.e., regions affected at fourth follow-up. The middle and the bottom graphs show GMV changes in the clusters timely associated with the emergence of Capgras delusion, i.e., right posterior cingulate gyrus/precuneus, and middle frontal gyrus/frontal eye field (respectively, centered at MNI coordinates x, y, z 4, –32, 44 and 28, 0, 51). Significant results are shown at p < 0.05 family-wise error corrected (FWE) at cluster level (cluster forming threshold p < 0.005). Images are displayed in radiological convention: left of the figure displayed on the right of the image.

