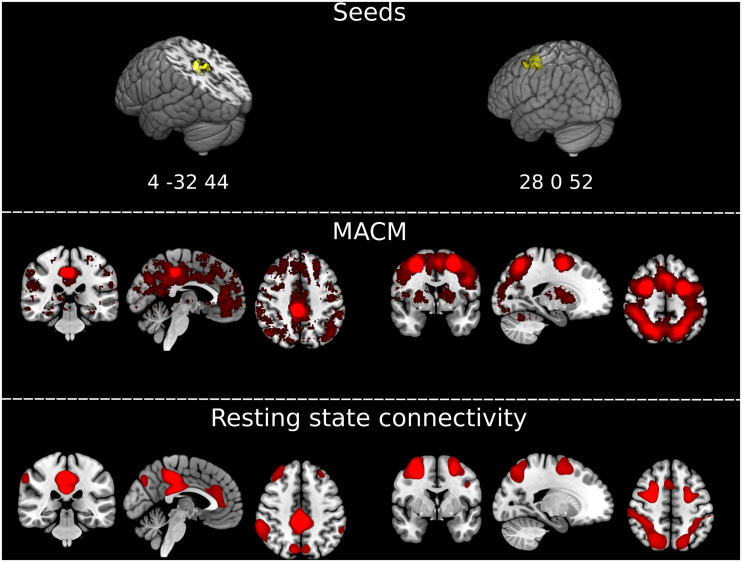
FIGURE 3.
Extracting functionally impaired brain networks by mapping atrophy to resting-state networks and functional co-activations. (Top) Graphical representation of the clusters of brain atrophy timely associated with the emergence of Capgras delusion, i.e., right posterior cingulate gyrus/precuneus, and middle frontal gyrus/frontal eye field. Coordinates of the maxima for each of the two clusters are reported in MNI space in the figure: x, y, z 4, –32, 44, and 28, 0, 52. (Middle) Results of the meta-analytic co-activation modeling (MACM) across >14,000 fMRI studies from the Neurosynth database (https://neurosynth.org/). Red blobs represent z-scores after correction for false discovery rate (FDR). (Bottom) Results of the seed-based resting-state functional connectivity analysis on an independent sample of N = 1,000 healthy controls generated with Neurosynth. Red blobs show Pearson’s correlations with the seed, thresholded at r ≥ 0.2, uncorrected. Images are displayed in radiological convention. Left of the figure displayed on the right of the image.

