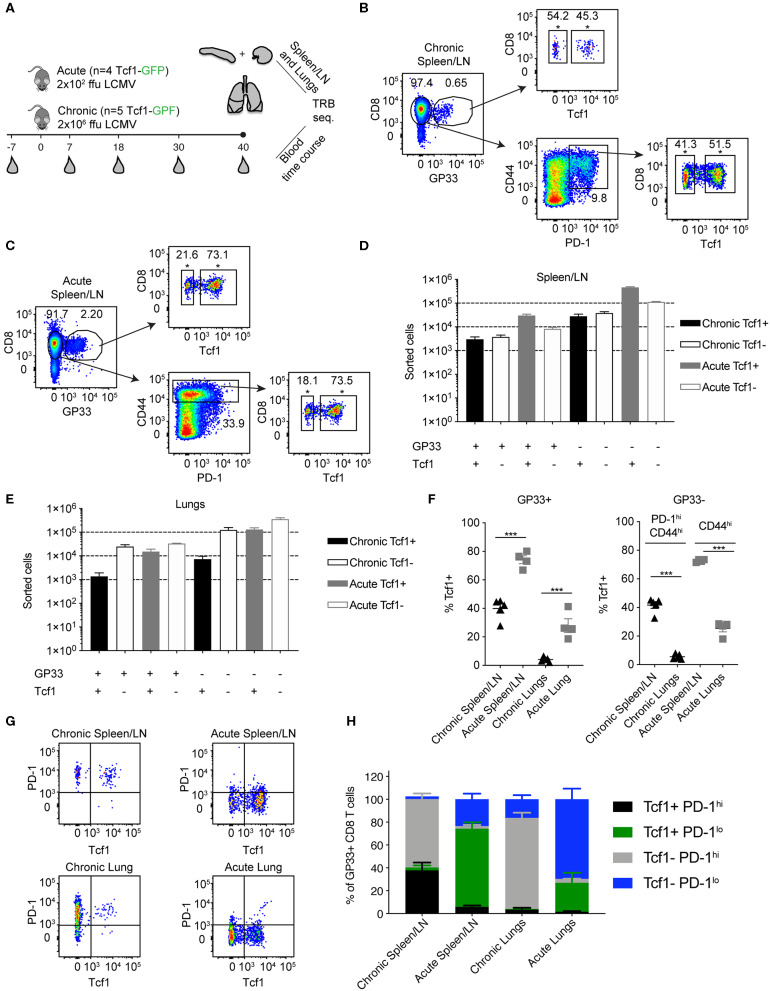
Figure 1.
Experimental setup for TCR-beta repertoire sequencing. (A) Both unsorted blood samples and sorted T cells from pooled spleen/LNs and lungs from acutely (2 × 10² focus forming units (ffu) and chronically (2 × 10⁶ ffu) infected Tcf7GFP mice were sampled for TCR-beta repertoire sequencing. (B,C) Representative FACS plots for sorting strategy for chronic and acute LCMV infection cohorts. Asterisks (*) indicate the final population for sequencing. (D,E) Sorted cell numbers for each of the populations included in TCR-beta sequencing experiments. Black bars indicate chronically infected mice and gray bars indicate acutely infected mice. Error bars indicate standard error of the mean. n = 4–5 mice for acute and chronic cohorts, respectively. (F) Frequency of Tcf1+ CD8 T cells in the pooled spleen/LN or lungs of chronically and acutely infected mice 40 dpi. Error bars indicate standard error of the mean. n = 4–5 mice per experiment. (G) Representative FACS plots displaying the relationship between Tcf1+ and PD-1 of GP33+ CD8 T cells 40 dpi. (H) Quantification of G. Error bars indicate standard error of the mean. n = 4–5 mice per experiment. *p ≤ 0.05, ***p ≤ 0.005, not significant (n.s.) p > 0.05.

