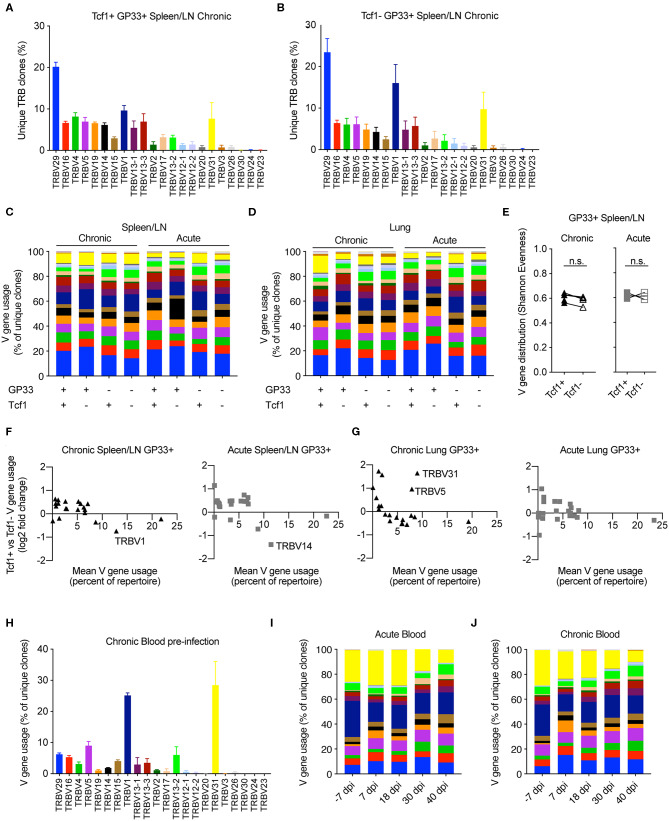
Figure 3.
Similar germline gene usage of Tcf1+ and Tcf1- repertoires. (A,B) Example TRB V-gene usage for the Tcf1+ and Tcf1– virus-specific repertoires from the spleen/LN 40 days post infection (dpi). Error bars indicate standard error of the mean. n = 4–5 mice per experiment. (C,D) Mean V-gene usage in each sequenced cohort determined by GP33 specificity and Tcf1 expression. (E) Shannon evenness quantifying the distribution of V-gene usage in the splenic repertoires. Values closer to 1 indicate even distributions of V-gene usage, whereas values closer to 0 indicate highly variable distributions of V-gene usage. (F,G) Up- and down-regulation of particular V-genes in Tcf1+ vs. Tcf1– negative repertoires for chronic and acute infections, respectively. Each point represents a different TRB V-gene segment. Y values >0 indicate that a given V-gene is on average upregulated in the Tcf1+ repertoire relative to the Tcf1– repertoire. (H) Example V-gene usage from bulk blood repertoires from the five mice in the chronic LCMV cohort before any viral infection. (I,J) Average V-gene usage in the blood repertoires at each time point for acute and chronic infection. n = 4–5 mice per experiment. not significant (n.s.) p > 0.05.

