Figure 6.
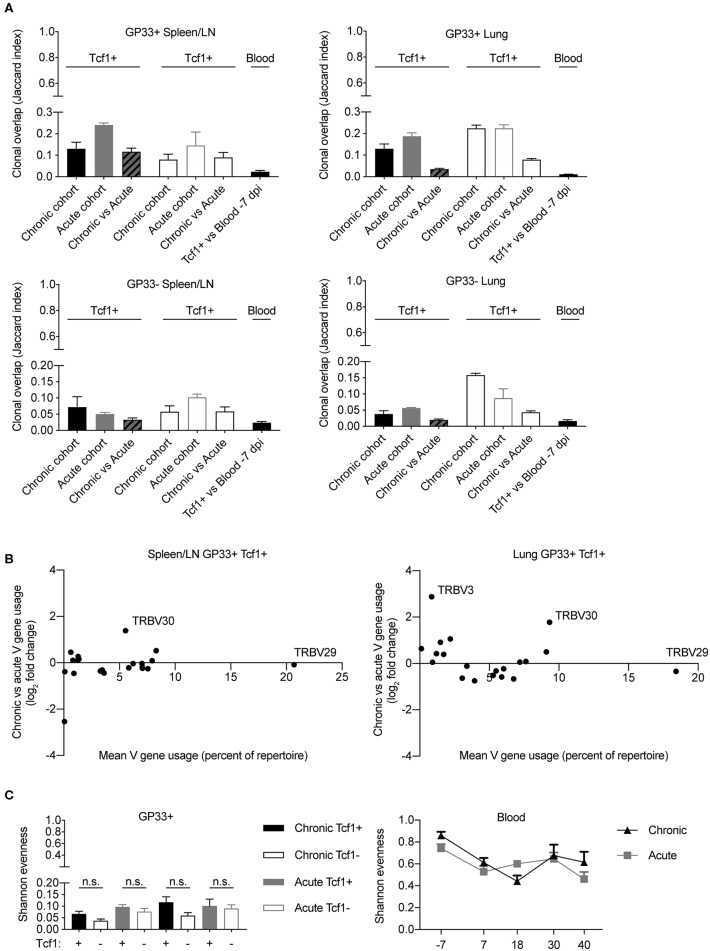
Minor differences between T cell repertoires from acute and chronic infection cohorts. (A) Jaccard index quantifying the clonal overlap between the repertoires of either animals within the same infection cohort (chronic vs. chronic, acute vs. acute) or across infection cohorts (chronic vs. acute). (B) Up- and down-regulation of particular V genes in chronic vs. acute GP33+ Tcf1+ repertoires. Each point represents a different TRB V gene segment. Y values >0 indicate that a given V gene is on average upregulated in the chronic GP33+ Tcf1+ repertoires relative to the acute GP33+ Tcf1+ repertoires. (C) Shannon evenness quantifying clonal expansion in the GP33+ and blood repertoires. Higher values indicate more similar levels of clonal expansion across the repertoire. not significant (n.s.) p > 0.05.

