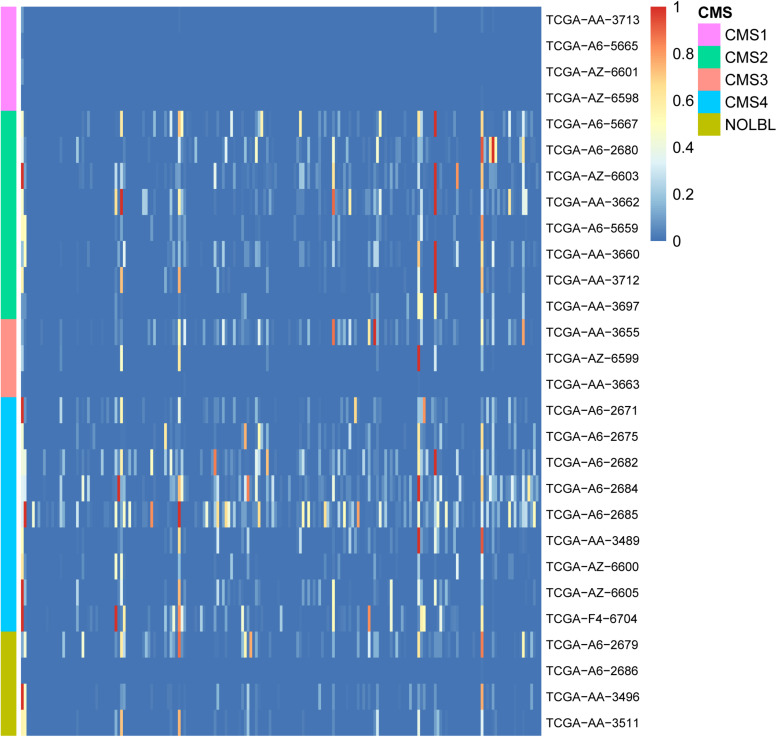
FIGURE 3.
Heatmap of enrichment analyses of 28 patient GCs in 189 cancer-related pathways. The horizontal axis shows 189 cancer-related gene sets, and the vertical axis shows the GCs of 28 patients. The color gradient in the figure from red to blue represents the corrected P-value of the hypergeometric test. The smaller the P-value, the more significantly the genes in the GC are enriched in the cancer-related gene set.

