FIGURE 1.
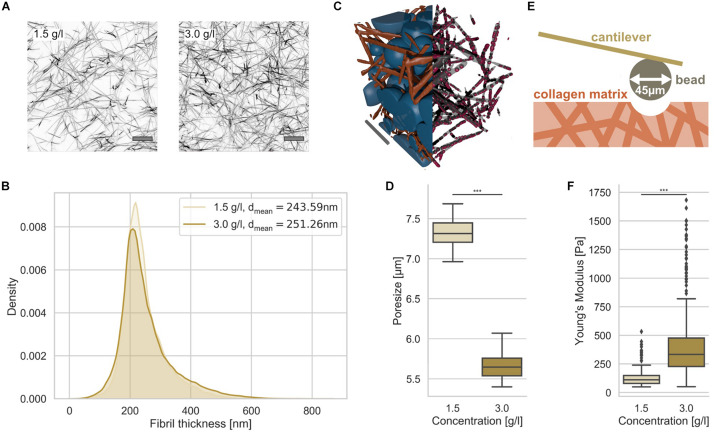
Characterization of 3D collagen matrices. (A) Representative image slices of TAMRA fluorescently labeled loose and dense 3D collagen networks. Scalebar is 10 μm. (B) Collagen fibril thickness histograms of the loose (1.5 g/l) and dense (3.0 g/l) 3D collagen matrices with mean. (C) Illustration of 3D matrix segmentation with collagen fibrils (orange) and detected pores (blue) (left half), fibrils in gray and measurement points in red (right half). Scale bar is 20 μm. (D) Pore-size values of loose and dense matrices. (E) Illustration of AFM-based matrix stiffness assay. The cantilever carries a bead with a diameter of 45 μm. (F) Matrix stiffness of loose and dense matrices determined with AFM. ***p < 0.001.

