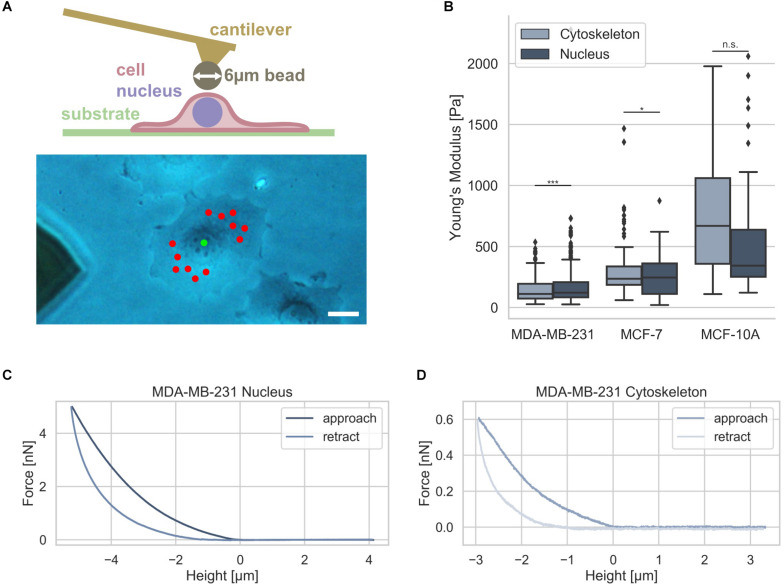
FIGURE 4.
Cell stiffness measurement of MDA-MB-231 and MCF-7 breast cancer cells using AFM. (A) Illustration of AFM measurement technique: an individual adherent cancer cell is measured with a 6 μm bead carrying cantilever. Exemplary measurement points for the cytoskeleton and the nucleus are indicated in a phase contrast image with the cytoskeletal measurement points depicted in red and nucleus measurement point in green. Scalebar is 10 μm. (B) Stiffness measurements of the cytoskeleton (light gray) and the nucleus (dark gray) of MDA-MB-231 and MCF-7 breast cancer cells as well as control mammary epithelial MCF-10A cells. Exemplary force-distance curves of MDA-MB-231 cells of the nucleus (C) and cytoskeleton (D) are presented. *p < 0.05, ***p < 0.001, and n.s., not significant.

