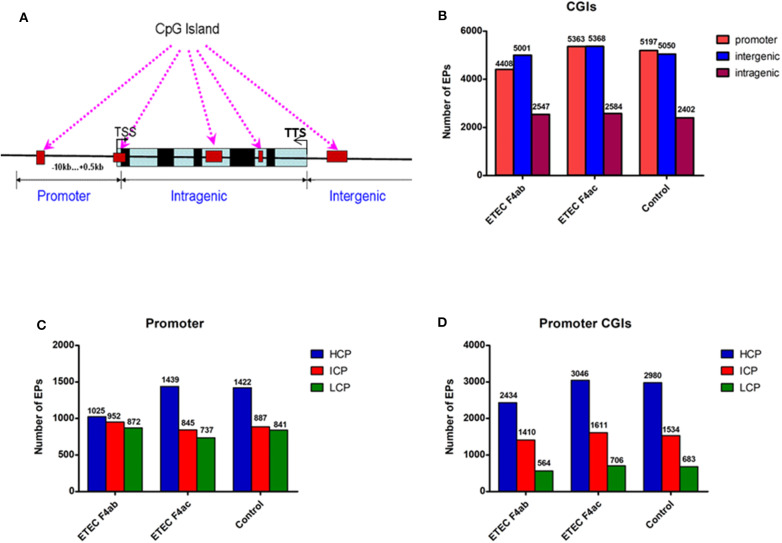
Figure 2.
Distribution of DNA methylation enrichment peaks in IPEC-J2 cells infected with ETEC F4ab, ETEC F4ac, and uninfected. (A) Generic diagram showing CpG islands (CGIs) relative to gene transcript regions. TSS: transcriptional start site. (B) Number of methylation enrichment peaks (EPs) in each CGI region per experimental group. (C) Number of EPs in each type of promoter. HCP, high CpG density promoter; ICP, intermediate CpG density promoter; LCP, low CpG density promoter. (D) Number of EPs in the promoter CGIs.

