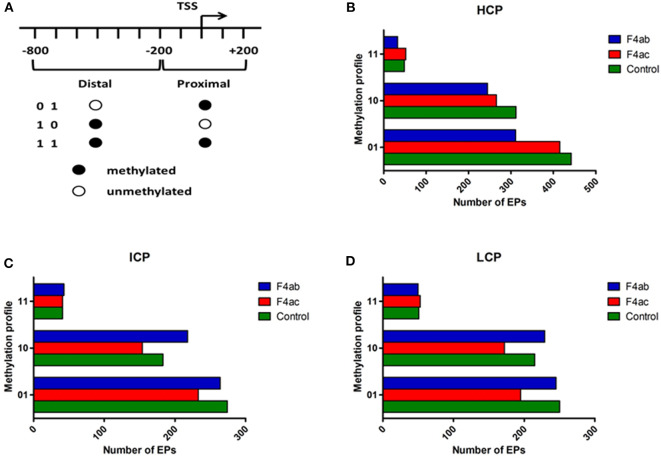
Figure 3.
Distribution of different methylation patterns of promoter regions around the TSS in the three groups. (A) Schematic of the designated promoter regions and their methylation profiles. “0” denotes unmethylated and “1” methylated. The number of methylation peaks and the methylation profiles in (B) HCP, (C) ICP, and (D) LCP for each experimental group. 01: proximally methylated; 10: distally methylated; 11: fully methylated.

