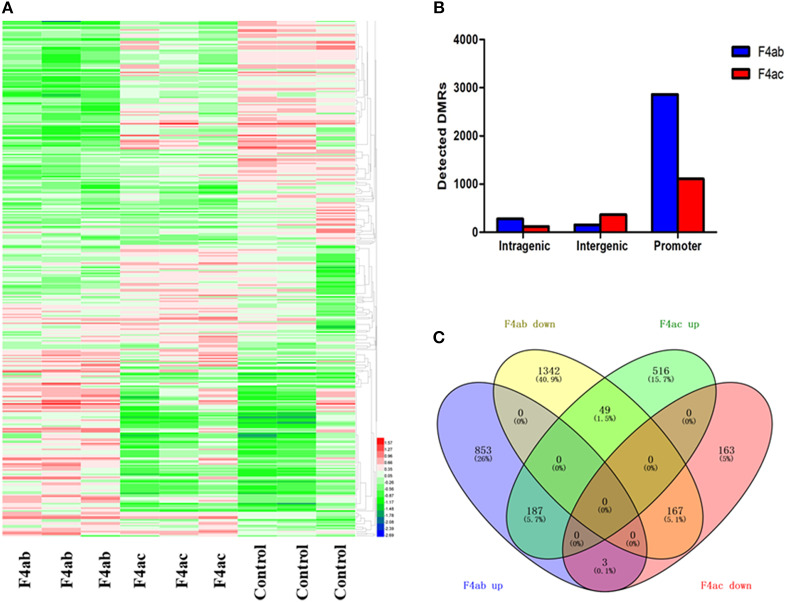
Figure 4.
(A) Heatmap of differential methylation among the nine samples. F4ab: IPEC-J2 cells infected with F4ab ETEC; F4ac: IPEC-J2 cells infected with F4ac ETEC; Control: uninfected IPEC-J2 cells. (B) Distribution of DMRs. Genomic coordinates for these feature types were obtained from the UCSC pig reference genome. F4ab: DMRs between F4ab infected and uninfected cells; F4ac: DMRs between F4ac infected and uninfected cells. (C) Venn diagram showing the relationships among the differentially methylated genes identified. F4ab down/up: hypomethylated/hypermethylated genes between F4ab and uninfected cells; F4ac down/up: hypomethylated/hypermethylated genes between F4ac infected and uninfected cells.

