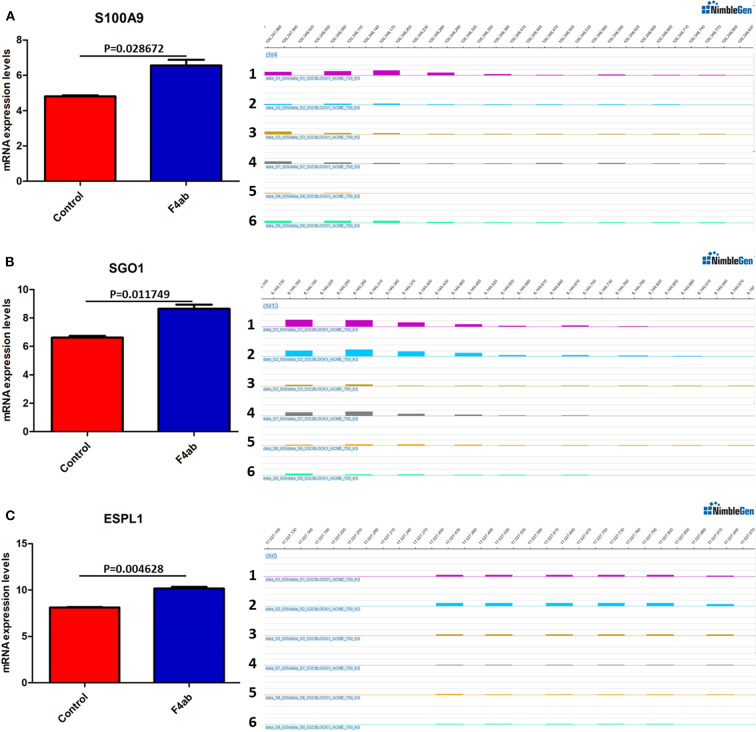
Figure 8.
DNA methylation and expression of (A) S100A9, (B) SGO1, and (C) ESPL1 in ETEC F4ab infected cells. These genes were all up-regulated (left panel) and hypomethylated (right panel) compared to uninfected controls. Panels 1-3 and 4-6 indicate the differentially methylated peaks in control and F4ab infected cells by MeDIP-chip (SignalMap software, NimbleGen). P < 0.01 and P < 0.05 indicate highly significant difference and significant difference between uninfected and F4ab infected cells, respectively.

