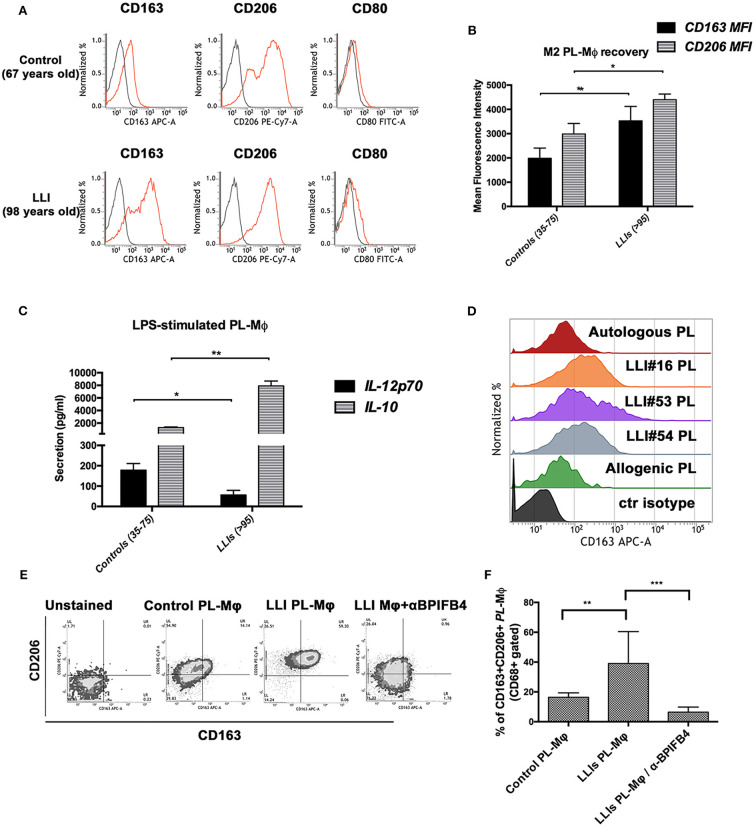
Figure 2.
In vitro conditioning with plasma from long living individuals leads to polarization of LLIs and controls macrophages toward M2 phenotypes. Macrophages were generated from peripheral blood monocytes of controls (35–75 years, N = 10) and of long living individuals (range 95–99, N = 10) upon 7 days in vitro culture with 20% autologous plasma. (A) Panel shows FACS histogram profiles of CD206, CD163, and CD80 protein levels at the cell surface of recovered MPL-macrophages (viable gated CD68+ cells) from a representative control volunteer (upper plots, 67 years-old male) vs. a representative LLI (lower plots, 98 years-old male). Cell staining was gated using isotype control antibodies (gray histograms). (B) Bars graph in panel report the mean fluorescence intensity (MFI) values ± SD of CD163 and CD206 M2 marker on viable CD68+ gated cells from controls (N = 10) and LLIs (N = 10). Pairwise comparisons statistically significant are indicated (ANOVA; *P < 0.05 and **P < 0.01). (C) IL-12p70 and IL-10 secretion by control and LLIs macrophages after 1 μg/ml LPS stimulation for 24 h. Cell culture supernatants were collected and cytokines secretion was determined using bead-based multiplex ELISA. Results were expressed as the mean ± SD of all sample determinations conducted in duplicate. All pairwise comparisons are statistically significant (ANOVA; *P < 0.05, **P < 0.01). (D–F) Peripheral blood monocytes of control volunteers (35–75 years, N = 10) were 7 days-exposed to plasma from LLIs (N = 10) and autologous or allogenic control plasma as comparison, in the presence or absence of BPIFB4 (1:100) blocking antibodies for the last 72 h of culture. After 7 days in vitro culture, cytofluorimetric analysis of recovered MPL-macrophages was conducted. (D) FACS histogram profiles for CD163 M2 markers in MPL-macrophages of both control plasma- and 3 representative LLIs-treated cells are shown. (E) Representative flow cytometry CD206 vs. CD163 density plots for each experimental condition is presented. (F) Bars graph report the percentage ± SD of CD206+CD163+ of gated MPL-macrophages from ten independent experiments using different donors (ANOVA; **P < 0.01, ***P < 0.001).

