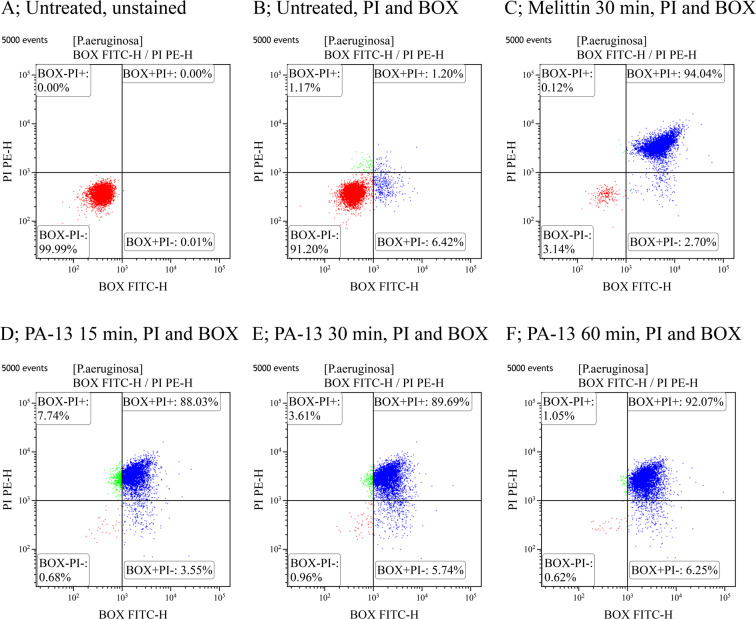
Figure 6.
Flow cytometry analysis of P. aeruginosa treated with PA-13 or melittin (control). (A) Untreated P. aeruginosa without PI and BOX. (B) Untreated P. aeruginosa with PI and BOX stained. The effect of melittin at 1 × MIC for 30 min (C) and PA-13 at 1 × MIC for 15, 30 and 60 min (D–F) on membrane permeability (PI) and membrane potential (BOX) of P. aeruginosa. The percentage of cell populations that fell in each gate are shown in the four corners of each plot.

