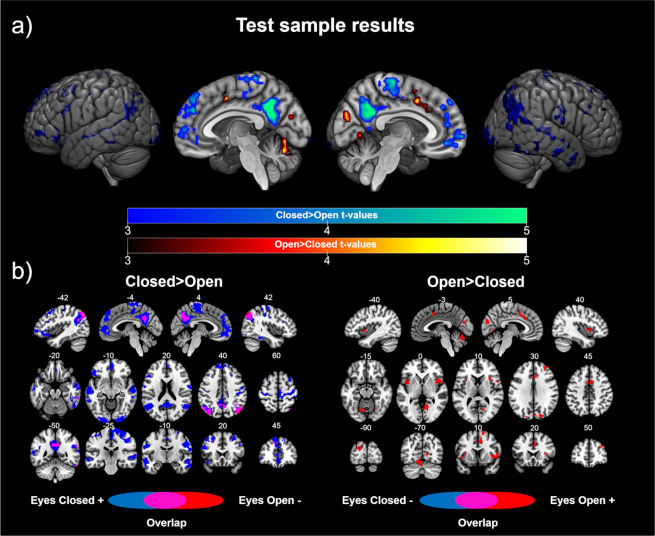
Figure 1.
Test sample results: (a) Differences in the functional connectivity of V1 according to eye state. Cold colors represent the brain regions showing higher connectivity with V1 in the eyes closed > eyes open contrast. Warm colors represent the brain regions showing higher connectivity with V1 in the eyes open > eyes closed contrast. The color bars represent the t value applicable to the image. (b) Contribution of each group to the significant differences. Blue colors represent the brain regions showing a correlation (positive for the contrast eyes closed > eyes open, left panel; negative for the contrast eyes open > eyes closed, right panel) with V1 in the eyes closed group. Red colors represent the brain regions showing a correlation (negative for the contrast eyes closed > eyes open, left panel; positive for the contrast eyes open > eyes closed, right panel) with V1 in the eyes open group. Purple colors represent brain areas showing a shift in the direction of the correlation with V1 according to the eye state. Numbers above slices represents the corresponding MNI coordinate in millimeters.

