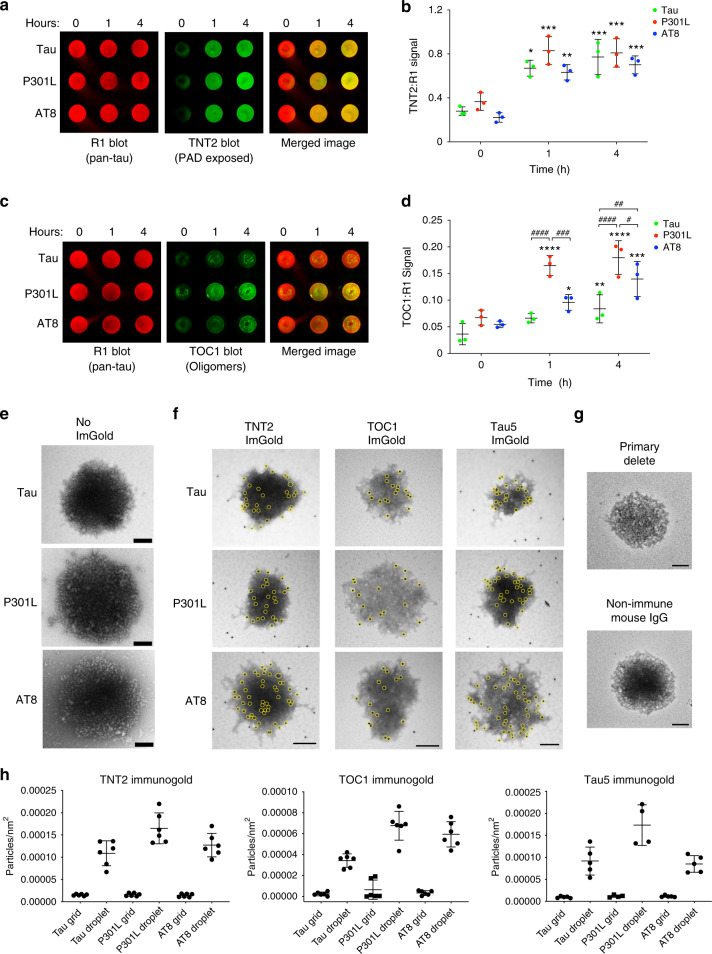
Fig. 7. Phase separation leads to formation of pathological tau conformations and oligomeric tau.
a Unlabeled tau, P301L and AT8 tau proteins incubated in LLPS buffer for 0, 1 or 4 h (each at 4 µM) were dot blotted and probed for total tau (R1 antibody) and PAD-exposed tau (TNT2 antibody). b Quantitation of dot blots show significant increases in PAD exposure upon incubation of tau, P301L and AT8 proteins with PEG for 1 and 4 h compared to 0 h (n = 3 independent experiments; two-way ANOVA with Sidak post-hoc test ***p < 0.0001, **p = 0.0001, *p = 0.0002 compared to respective 0 h time point; graphs are mean ± SD). c Representative dot blot images of unlabeled tau, P301L and AT8 tau proteins incubated for 0, 1 or 4 h in LLPS buffer and probed for total tau (R1 antibody) and oligomeric tau (TOC1 antibody). d Quantitation of dot blots show significant time-dependent increases in oligomeric tau species upon LLPS of tau, P301L and AT8 with significantly more TOC1 reactivity in the P301L and AT8 samples compared to tau (n = 3 independent experiments; two-way ANOVA with Sidak post-hoc test, ****p < 0.0001, ***p = 0.0003, **p = 0.0402, compared to respective 0 h time point, *p = 0.0420 compared to respective 0 and 4 h time point, ####p < 0.0001, ###p = 0.0017, ##p = 0.0095, #p = 0.0328; graphs are mean ± SD). e Transmission electron micrographs of negatively stained liquid droplets composed of unlabeled tau, P301L tau and AT8 tau (4 µM, 4 h incubation). Scale bars are 200 nm. f Immunogold labeling of tau, P301L and AT8 liquid droplets (4 µM, 4 h incubation) confirm the presence of PAD-exposed tau (TNT2 antibody) and oligomeric tau (TOC1 antibody) within droplets. A pan-tau antibody (Tau5) confirmed the structures are composed of tau. Yellow circles are around gold particles for easier visualization and scale bars are 200 nm. g Primary antibody delete and non-immune mouse IgG (substituted as the primary antibody) controls confirm the specificity of the immunogold labeling in f. Scale bars are 200 nm. h Quantitation of gold particle density demonstrates a clear increase in labeling (~10-fold) with each antibody within droplet when compared to the grid, confirming the specificity for labeling within droplets (graph represents mean ± SD). Source data for a–d, h provided in the Source Data file.

