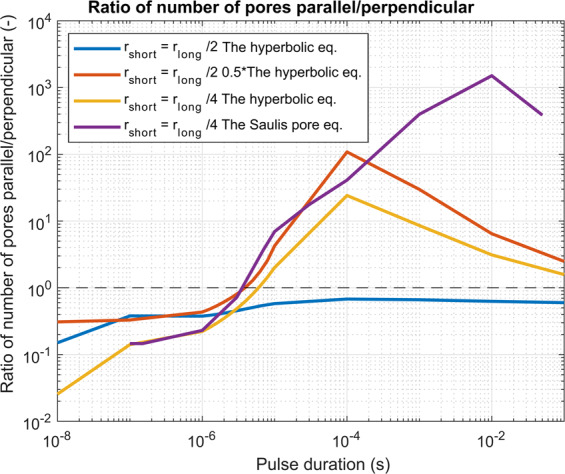
Figure 4.

A numerically determined ratio of the number of pores when cells orientation is parallel vs perpendicular. Different examples are shown: when a cell is of different geometry (ratio 1:2 and 1:4) and/or when equivalent pulse parameters are calculated as the hyperbolic equation, scaled hyperbolic equation or with the Saulis pore equation. We can see that in all cases with nanosecond pulses the perpendicular direction was more efficient in pore formation and the crossover was obtained in the range of 3 to 6 microseconds, depending on the cell geometry and applied an electric field. The black dashed line shows the ratio of 1 where perpendicular and parallel orientation are equivalent.
