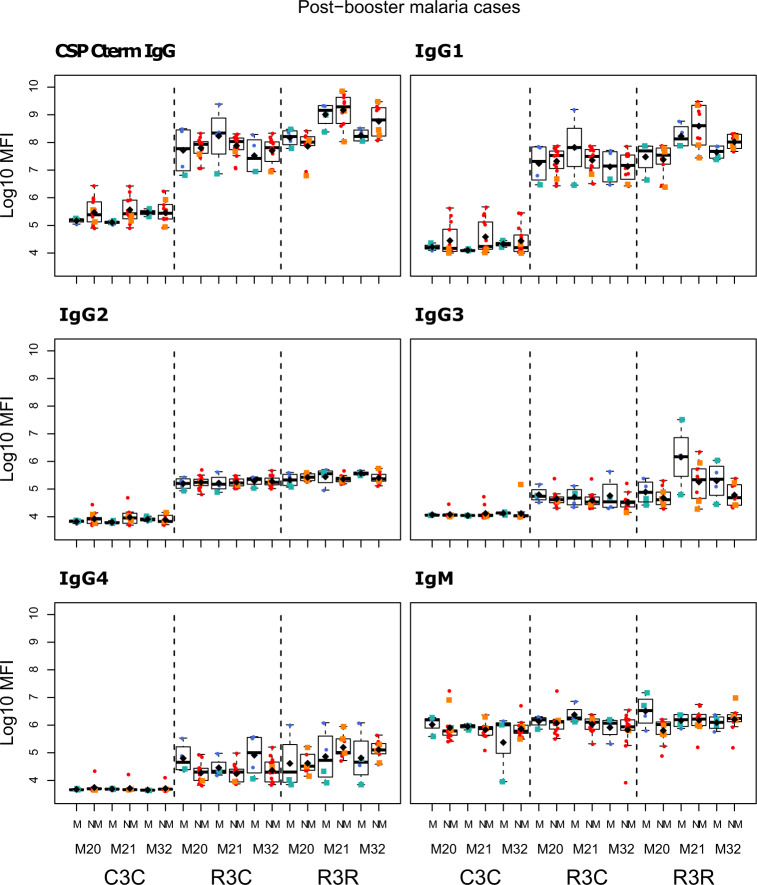
Fig. 10. Immunogenicity stratified by clinical malaria after M21: total IgG, IgG1-4 subclasses and IgM for CSP C-term at month (M) 20, 21, and 32 for RTS,S/AS01 vaccinees with (R3R) and without (R3C) booster, and comparator (C3C).
Stratified analysis by malaria after M21, subjects who presented with clinical malaria (M = blue) and subjects without malaria (NM = red). Subjects who presented with clinical malaria before M20 are represented with green and orange squares. Boxplots with medians, interquartile ranges (IQR), upper whisker as the smallest between maximum × value and Q3 + 1.5*IQR, lower whisker as the largest between minimum × value and Q1 – 1.5*IQR, and log10(geometric mean(MFI)) (diamond). Non-parametric tests were used to compare levels with or without clinical malaria (NM vs. M). p-values were adjusted for multiple comparisons, but none was significant. Only p-values < 0.05 before adjustment are shown. The y-axis is in logarithm 10 scale. R3R: three doses of RTS,S/AS01E and a RTS,S/AS01E booster. R3C: three doses of RTS,S/AS01E and a comparator booster. C3C: three doses of a comparator vaccine and a comparator booster.

