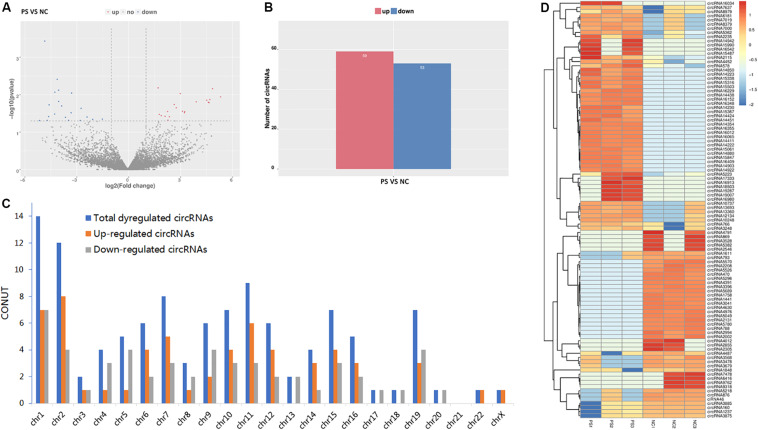
FIGURE 2.
Differentially expressed (DE) circRNAs in PS and NC. (A) and (B) display the volcano plot and bar graph for the DE circRNAs in the samples of the two groups. (C) The chromosome distributions of differentially expressed circRNAs. (D) The DE circRNAs and samples are coclustered by hierarchical clustering analysis. The upper maps are based on DE circRNAs with log2 (fold change) >1 or log2 (fold change) <-1 and p value <0.05 for the comparisons of PS vs NC.

