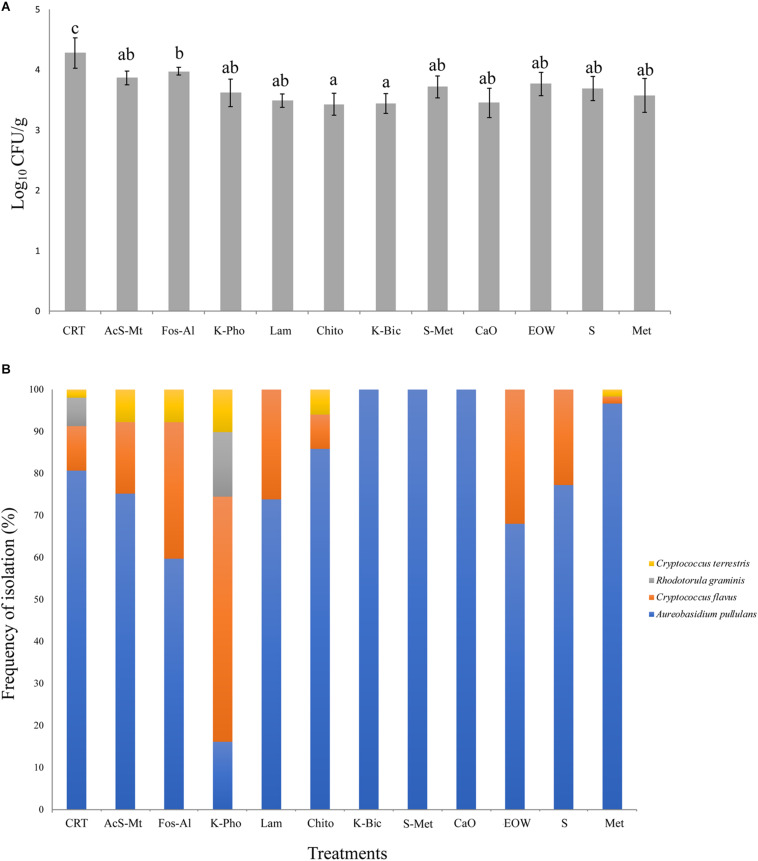
FIGURE 2.
Fungal load, as determined by microbiological analysis on WLN medium, expressed in Log10 CFU/mL. The bars represent mean values and standard deviation from four replicates for each treatment. Different letters mean significant differences (p < 0.05) (A). Fungal species biodiversity: for each treatment, the frequency of isolation of the four species detected is expressed as a percentage. Isolates grown on WLN medium were grouped based on colony morphology and representatives of each colony type were identified to species level by molecular methods (B). Treatment descriptions are reported in Table 1.

