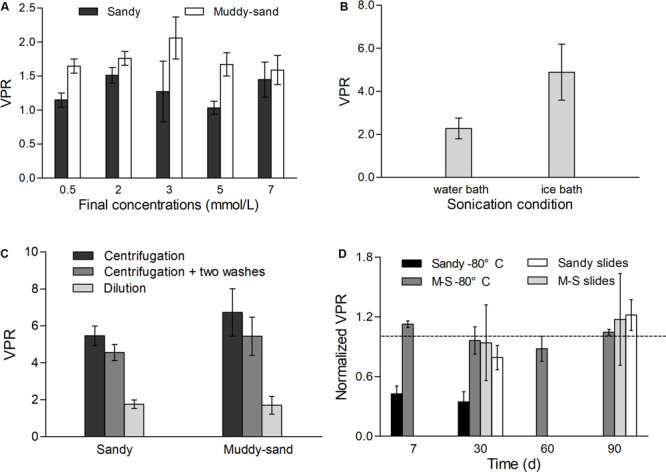
FIGURE 2.

The impact of processing methods on VPR, each test was performed with three replicates. Panel (A) shows the effect of final concentration of sodium pyrophosphate in sandy and muddy-sand sediments. Panel (B) shows the effect of sonicating in the water bath and ice bath in sandy sediment. Panel (C) shows the effect of dilution, centrifugation, and centrifugation with two washes on VPR in sandy and muddy-sand sediments. And panel (D) shows the effects of –80°C preservation for sandy and muddy-sand (M-S) sediments and slides preservation for sandy slides and muddy-sand (M-S) sediments on VPR. VPR values were normalized to the VPR of fresh sediments (dotted line).
